One size did not fit all for Utilities apps in 2020. Depending on industry (energy, manufacturing, security, et. al.), issues with supply chains, global price drops, and budget constraints impacted each brand differently.
In our 2021 Mobile App Engagement Benchmark Report, a study of 1,000 apps across a billion+ app installs, we take a close look at apps in the Utilities category. Regardless of their business focus, mobile teams working in Utilities showed great emphasis on collaboration and flexibility that will continue to change how apps are designed, built, and leveraged across their business in years to come.
Read on for data-supported benchmarks Utilities apps should focus on in 2021 and beyond based on what was learned from a year like no other.
2021 Engagement Benchmarks for Utilities Apps
Ratings and Reviews
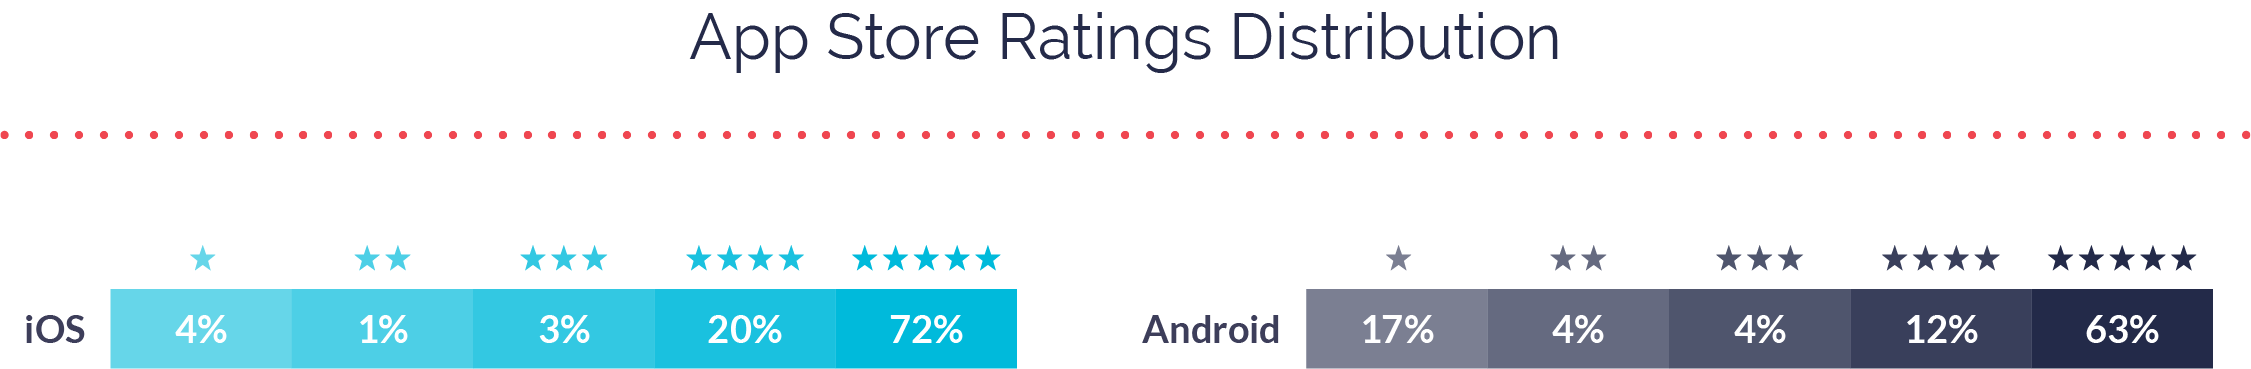
Utility apps ratings and reviews were around or slightly lower than macro app averages. The average iOS app saw a 31,127 app store ratings, received a 4.58 star rating, and received 319 app store reviews. Android apps saw many fewer ratings (12,877), received a 3.96 star rating, and had 1,223 reviews.
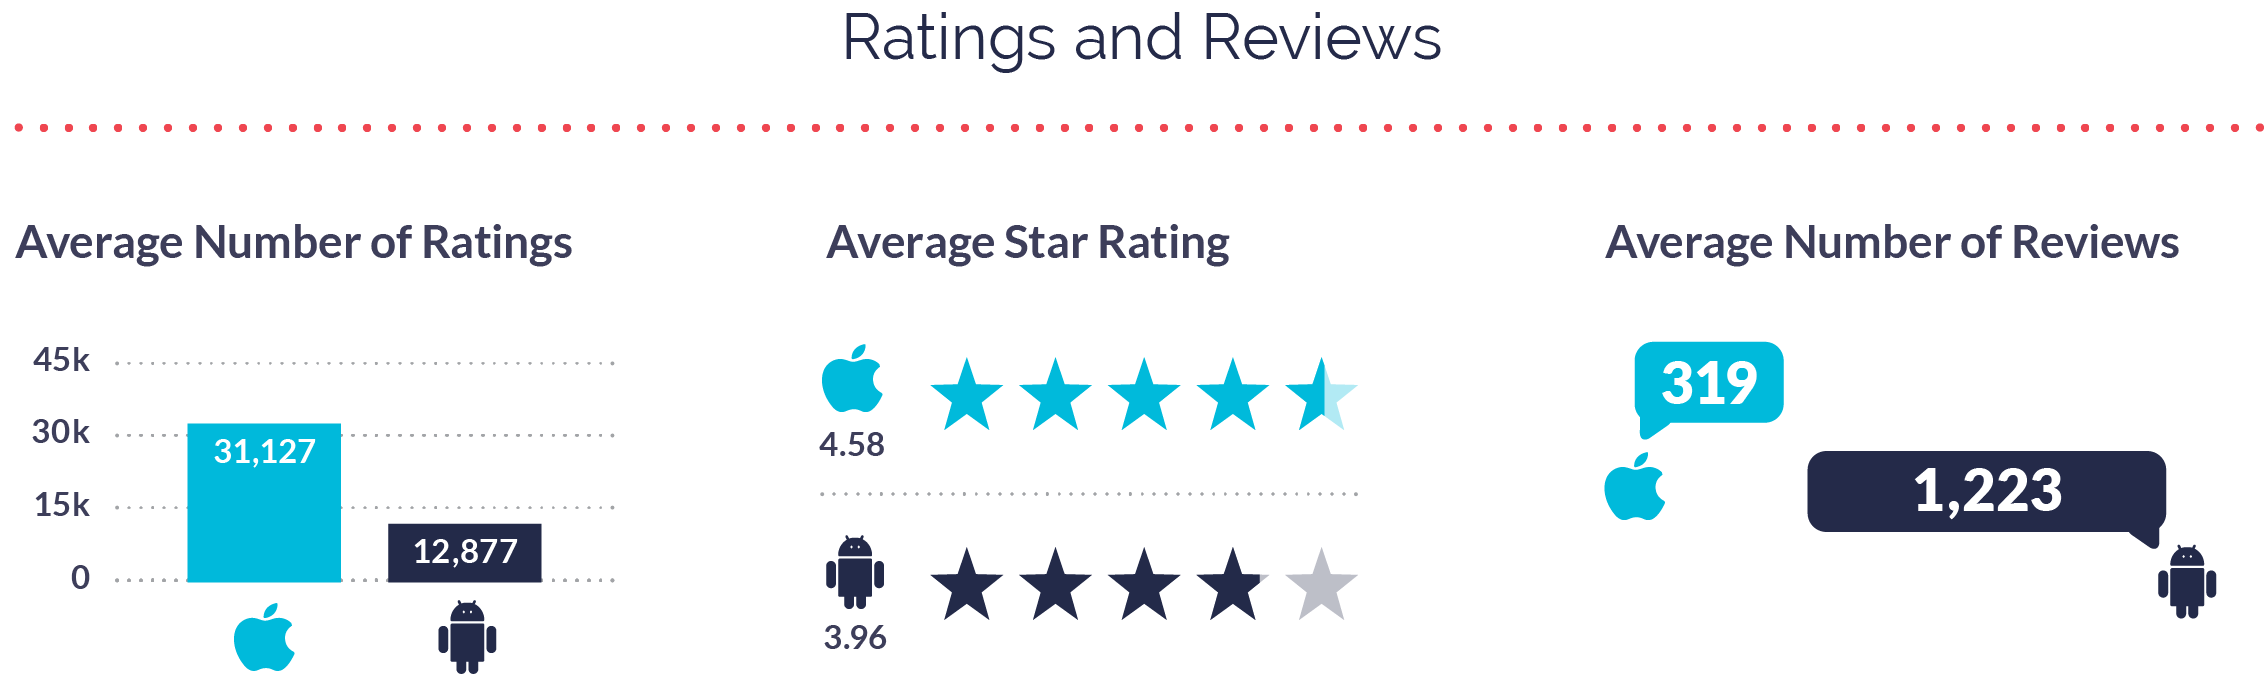
Similarly to previous years, iOS apps again enjoyed a higher overall rating; however, Android narrowed the gap between two in 2020, likely due to the new weighting system that Google employed in late 2019.
The big takeaway for Utilities apps is while you can’t mitigate every negative rating or comment, having a plan in place to directly receive negative feedback will help you improve your numbers.
Retention
Collectively, Utilities apps had 90-day retention rates slightly lower than the macro average (48%) and much lower than the annual average (35%). But when consumers were proactively engaged, their short-term and long-term retention rates rose significantly and ended higher than macro averages (80% for both). This was true for both Fans and Risks. Retention tends to dramatically improve when people are engaged, which consumers of Utilities apps made abundantly clear.
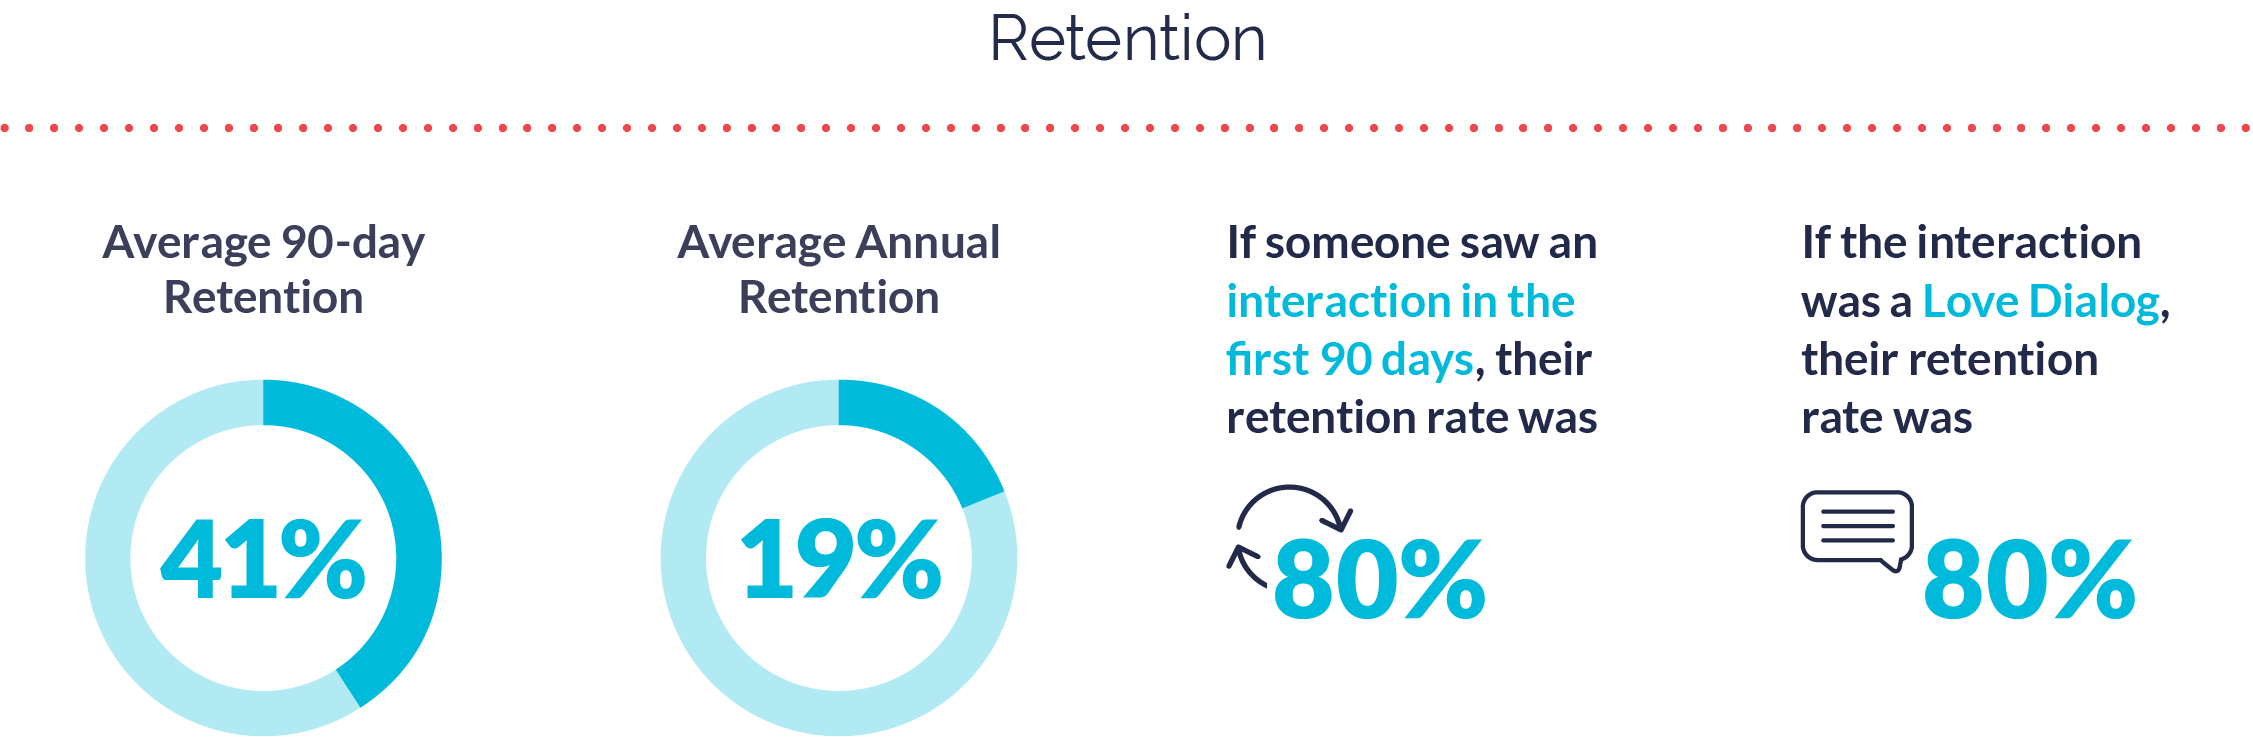
Obviously many factors contributing to the drops in Utilities app retention were outside of mobile teams’ control. While concerning, this is a solvable problem for mobile teams in 2021 as people slowly begin to travel again.
Surveys and Messages
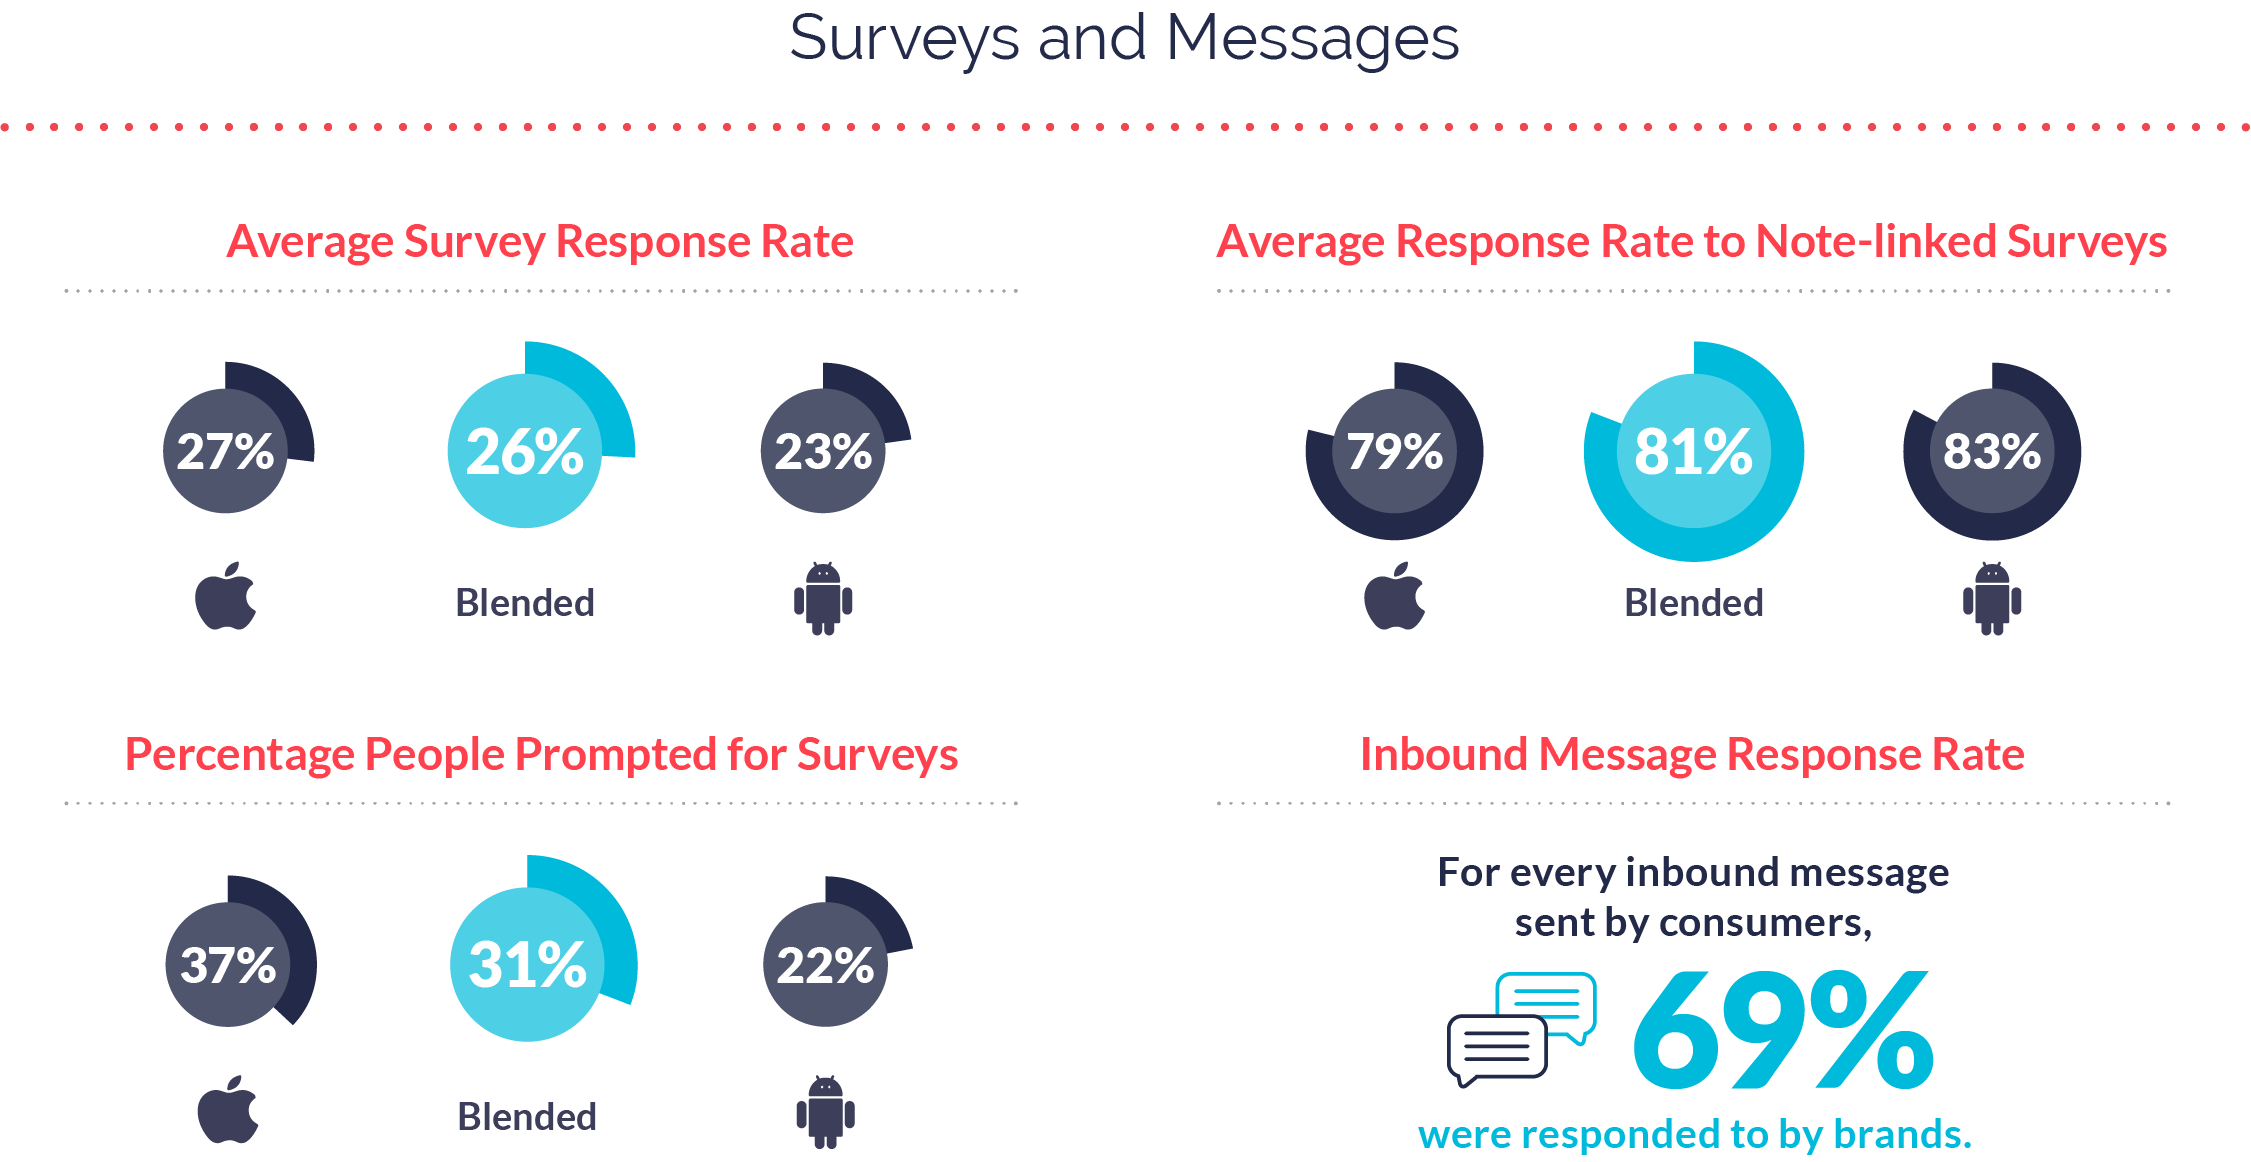
Utilities mobile teams also increased the percentage of people they prompted for feedback in 2020 to 31%, which is higher than the macro average of 25%.
Interaction and Response Rates
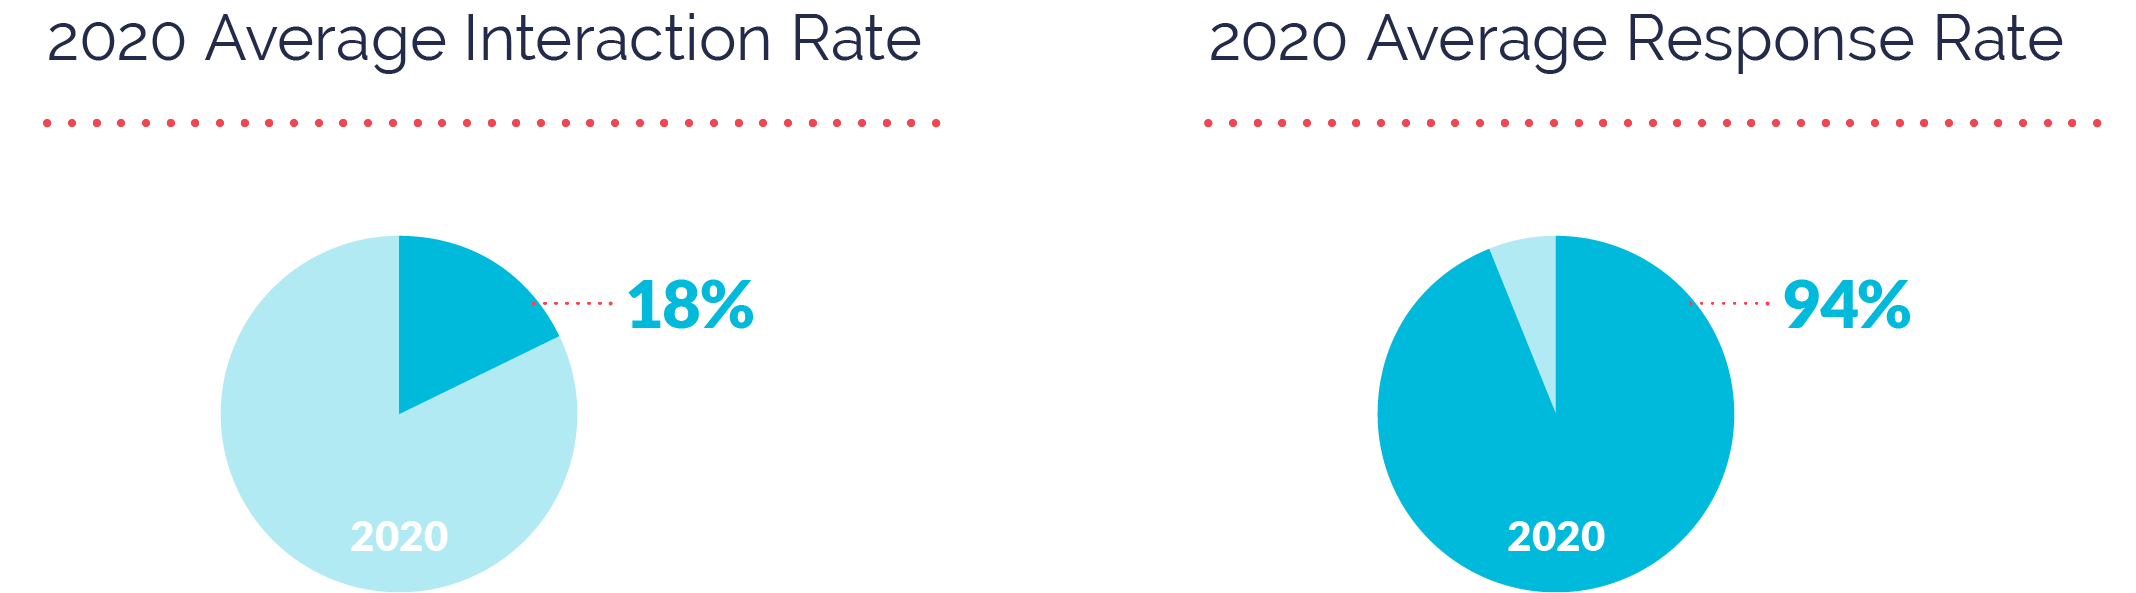
COVID-19 had the strongest negative impact on interactions in Utilities apps. Interaction rates for Utilities apps were 18%, lower than the macro average of 26%. That said, Utilities mobile teams deserve immense credit for their extremely high response rates (94%) that held steady throughout the year. These teams clearly understand that when consumers reach out, responding to understand and act on emotion is the best strategy.
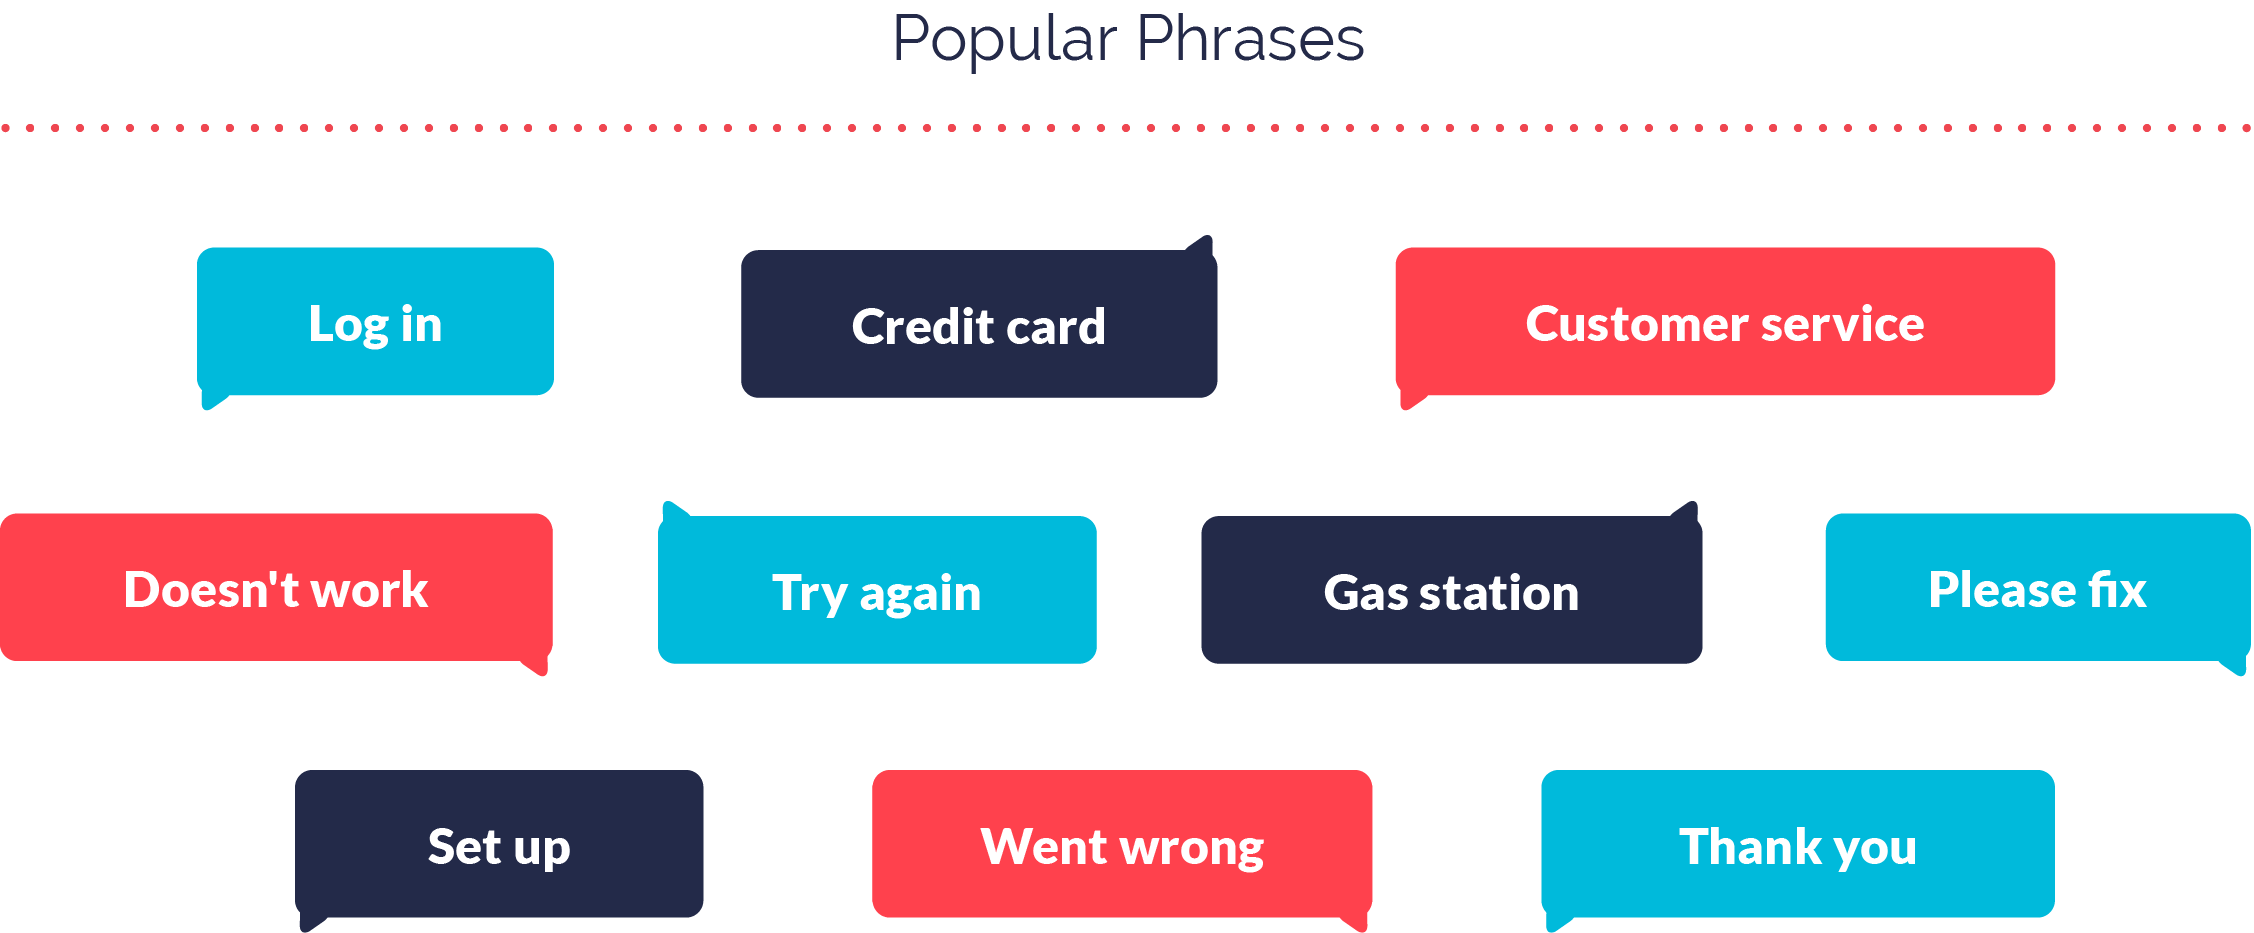
Popular Phrases
Shifting our focus to app store reviews. Below are the 10 most popular phrases in both iOS and Android app store reviews throughout 2020.
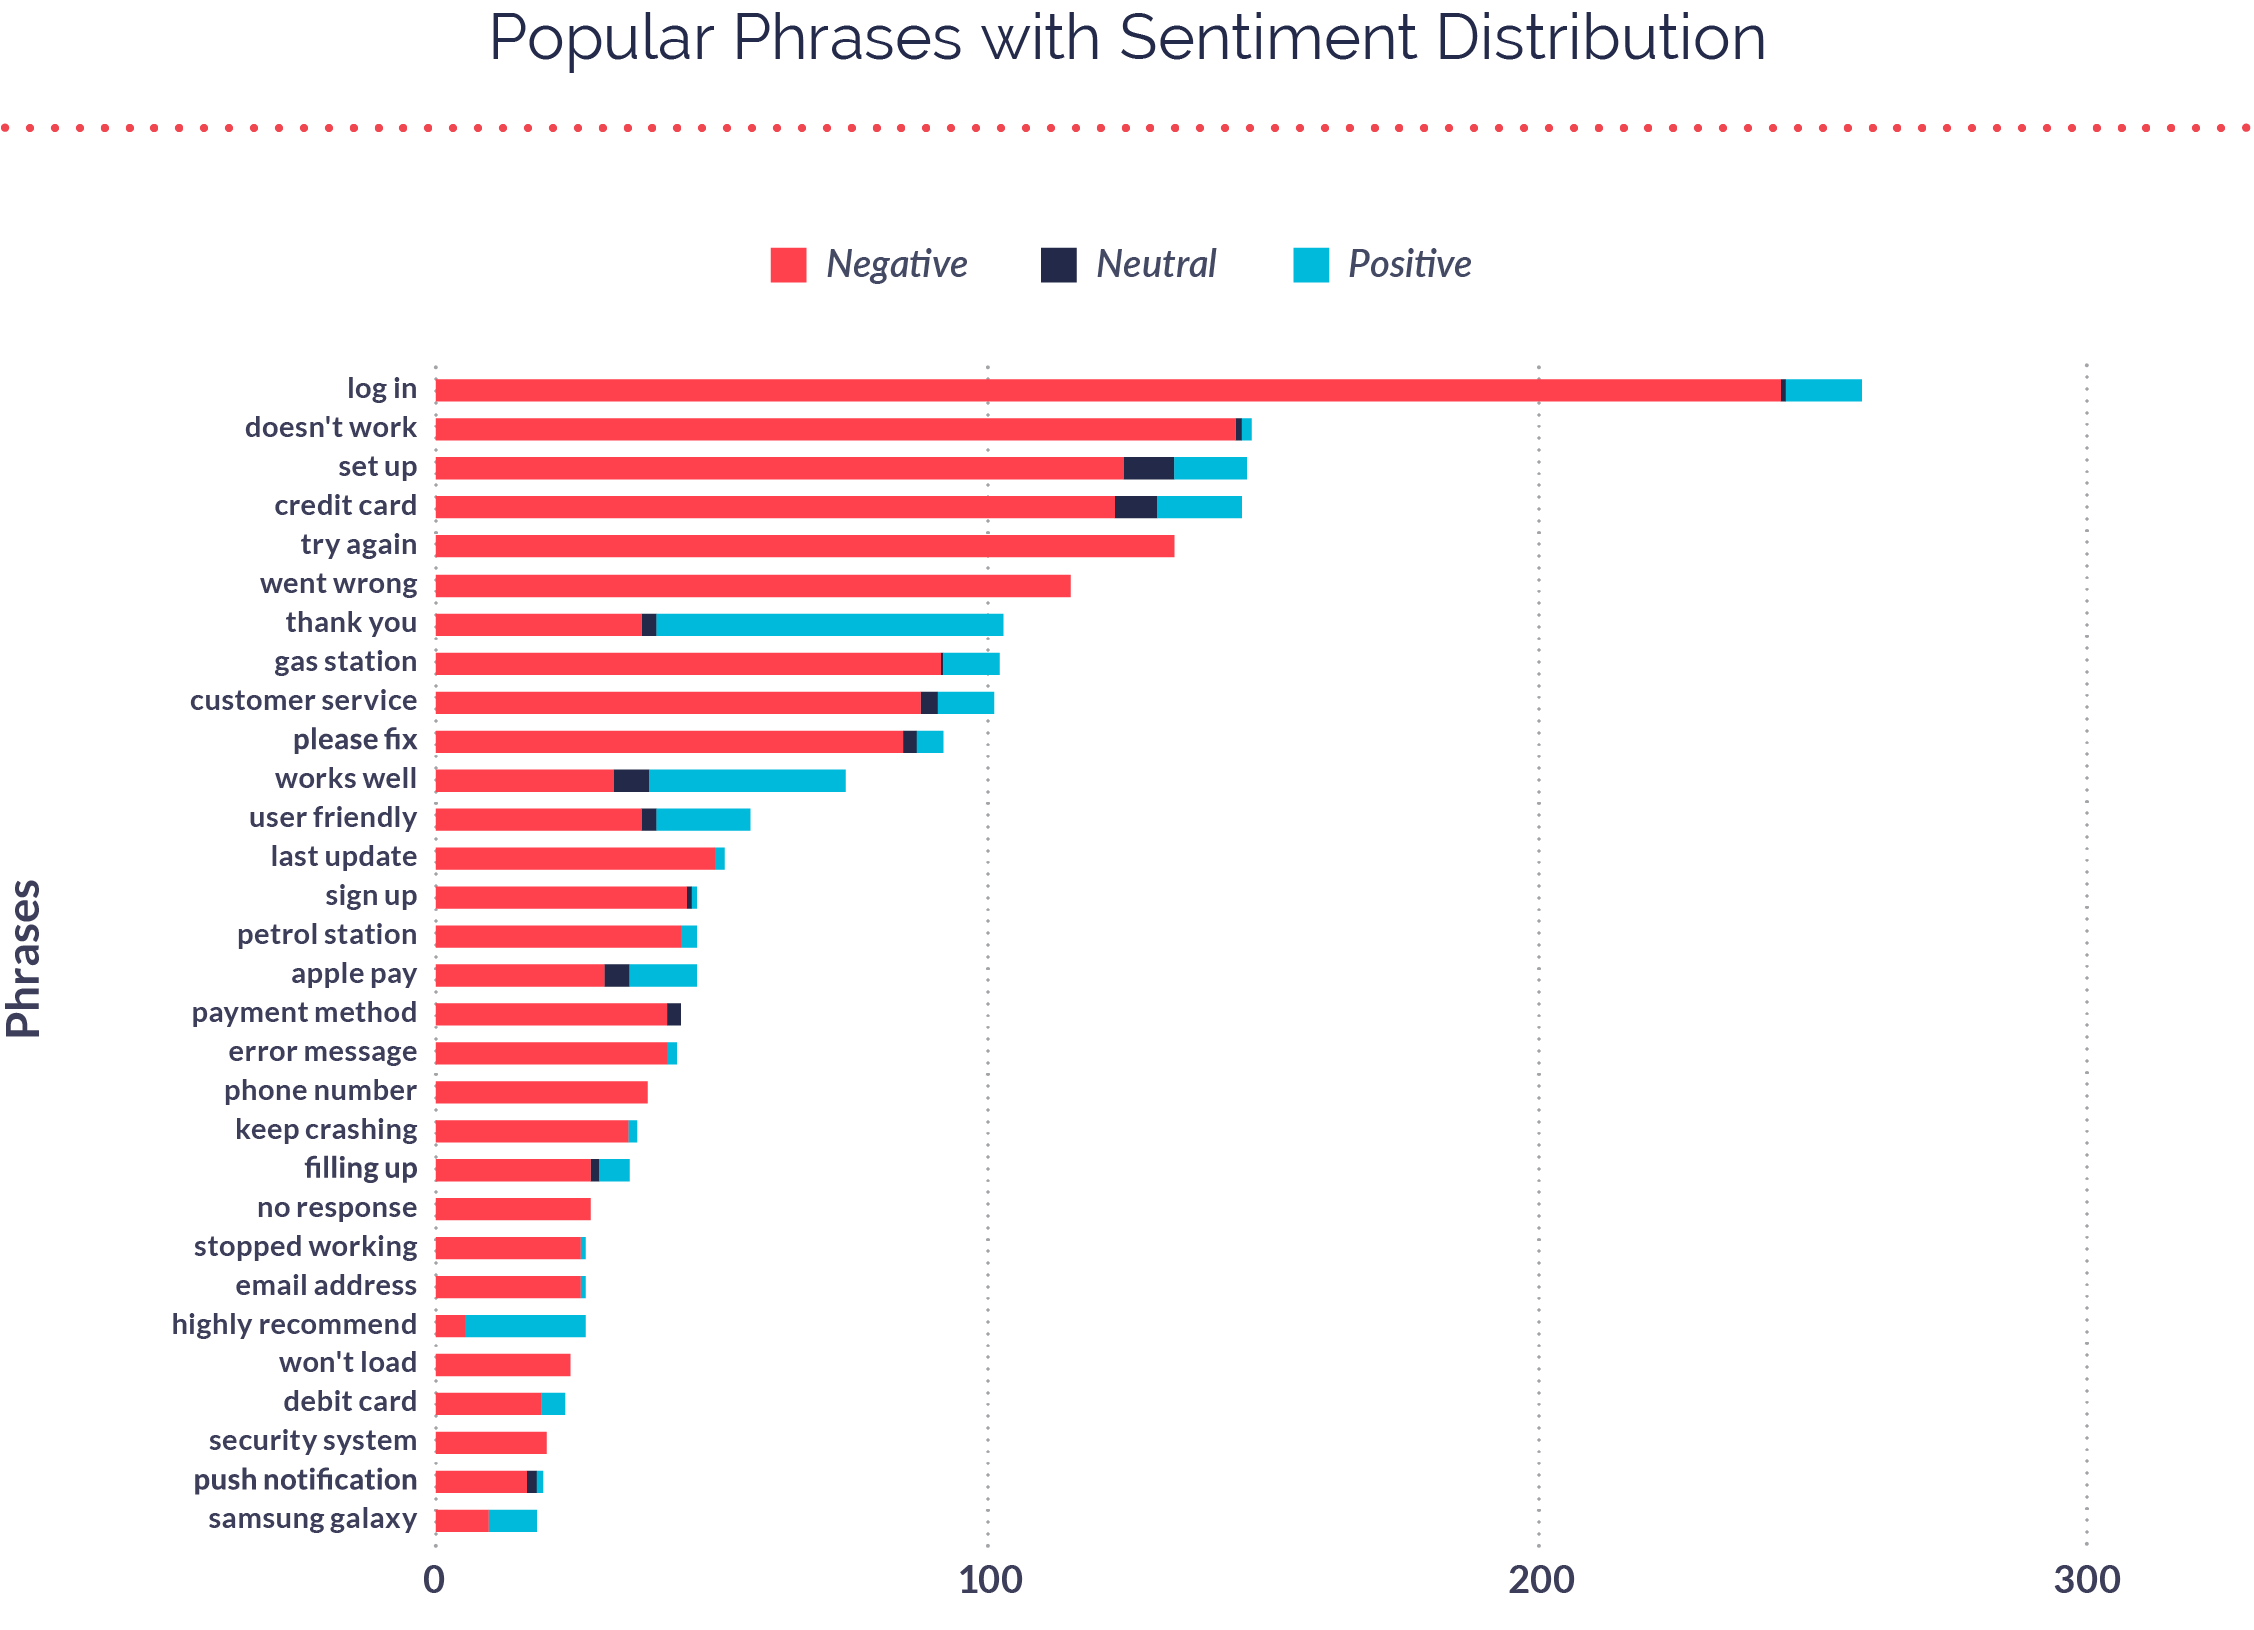
When we layer on sentiment distribution, you can see the difference between negative, neutral, and positive sentiment across app store reviews. The Utilities app category is especially prone to negative sentiment through reviews due to the nature of their business; it’s easy for consumers to leave frustrated feedback in the moment, and even easier for them to forget about positive experiences once they conclude.
Working in Mobile Utilities in 2021
Utilities apps in our study experienced change in consumer engagement, customer retention, daily active usage, emotion-based feedback, consumer interactions, ratings and reviews, and more. These changes were driven by a variety of unprecedented factors due to the coronavirus epidemic and generally had a fluctuating impact on the category.
As the data shows, Utilities apps are beginning to recover, but still have a long road ahead. For more on how mobile teams in Utilities can win back market share and improve feedback-based innovation, read our 2021 Mobile App Engagement Benchmark Report.
