The food and drink industry was heavily impacted by restrictions on dining, shopping, and delivery in 2020. While the year was disastrous for many food and drink companies, there were also many whose apps tell incredible tales of resilience, ingenuity, and embracing the digital shift.
In our 2021 Mobile App Engagement Benchmark Report, a study of 1,000 apps across a billion+ app installs, we take a close look at apps in the Food and Drink category. In our research, Food and Drink apps are separated into two subcategories: Restaurants (both QSR and sit down) and Food Services (grocery, food delivery, digital recipes, etc.).
Read on for data-supported research and benchmarks Food and Drink apps should focus on in 2021 and beyond based on what was learned from a year like no other.
2021 Engagement Benchmarks for Food and Drink Apps
Ratings and Reviews
Food and Drink app ratings and and reviews were slightly higher than macro averages across both iOS and Android, particularly within the Restaurants category. The average iOS app saw 346,599 app store ratings, received a 4.74 star rating, and had 1,223 app store reviews. Android apps saw 45,642 app store ratings, received an average 3.96 star rating, and had 4,695 app store reviews.
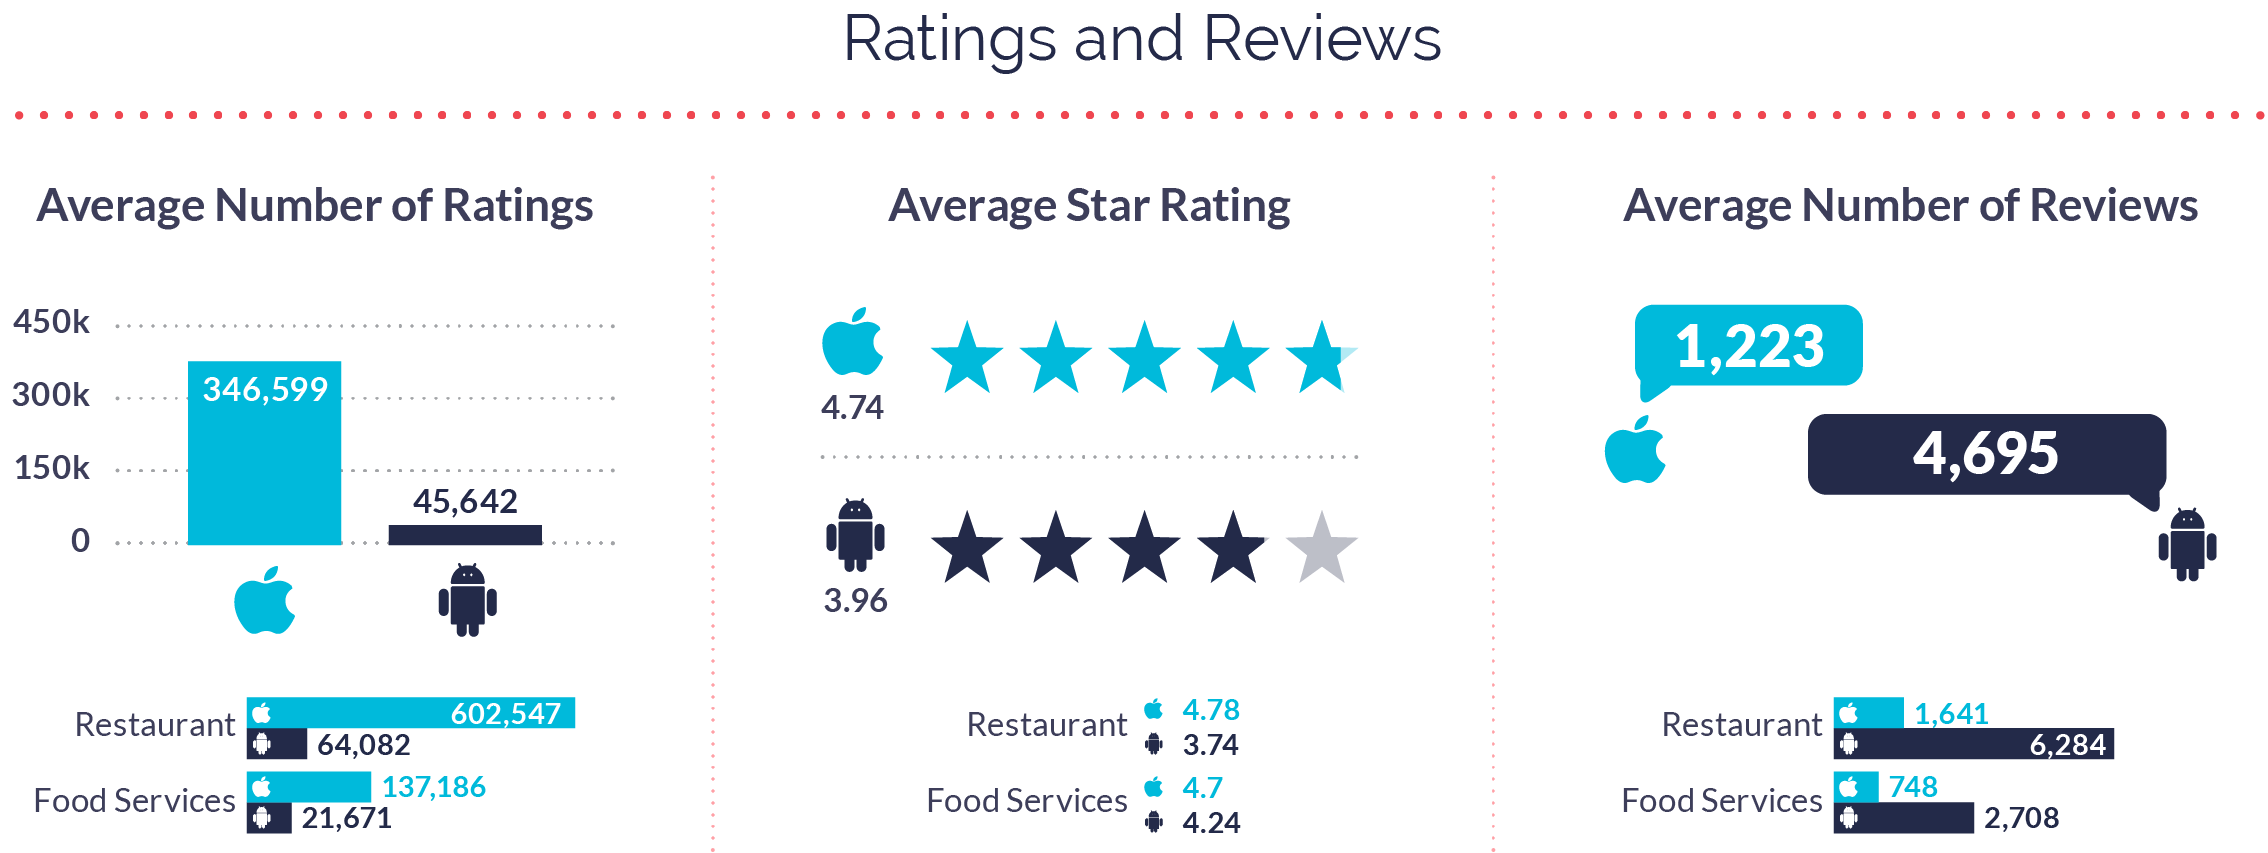
Similarly to previous years, iOS apps again enjoyed a higher overall rating; however, Android narrowed the gap between two in 2020, likely due to the new weighting system that Google employed in late 2019.
The big takeaway for Food and Drink apps is while you can’t mitigate every negative rating or comment, having a plan in place to directly receive negative feedback will help you improve your numbers.
Interactions
Monthly interactions in Food and Drink apps were closely correlated to the months when COVID-19 lockdowns were at their most extreme. March through May shows an increase in interactions, leveling out in June and ticking back up in October.
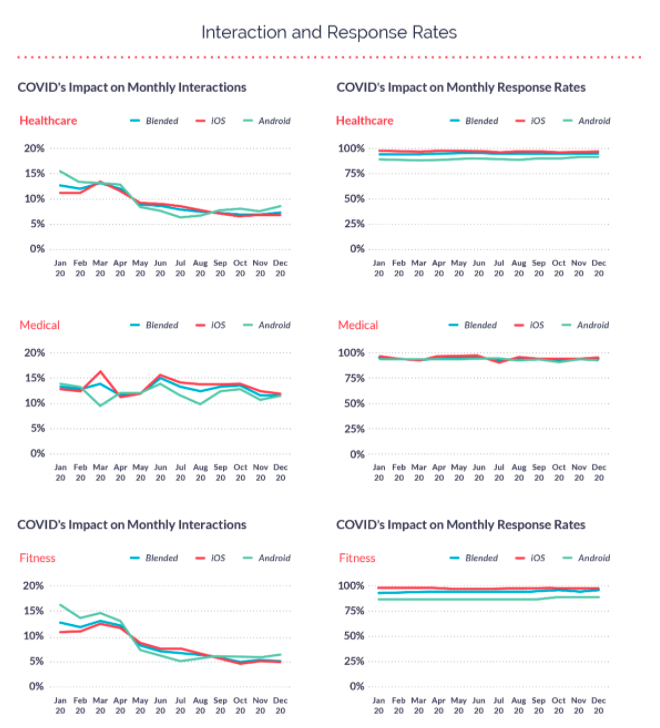
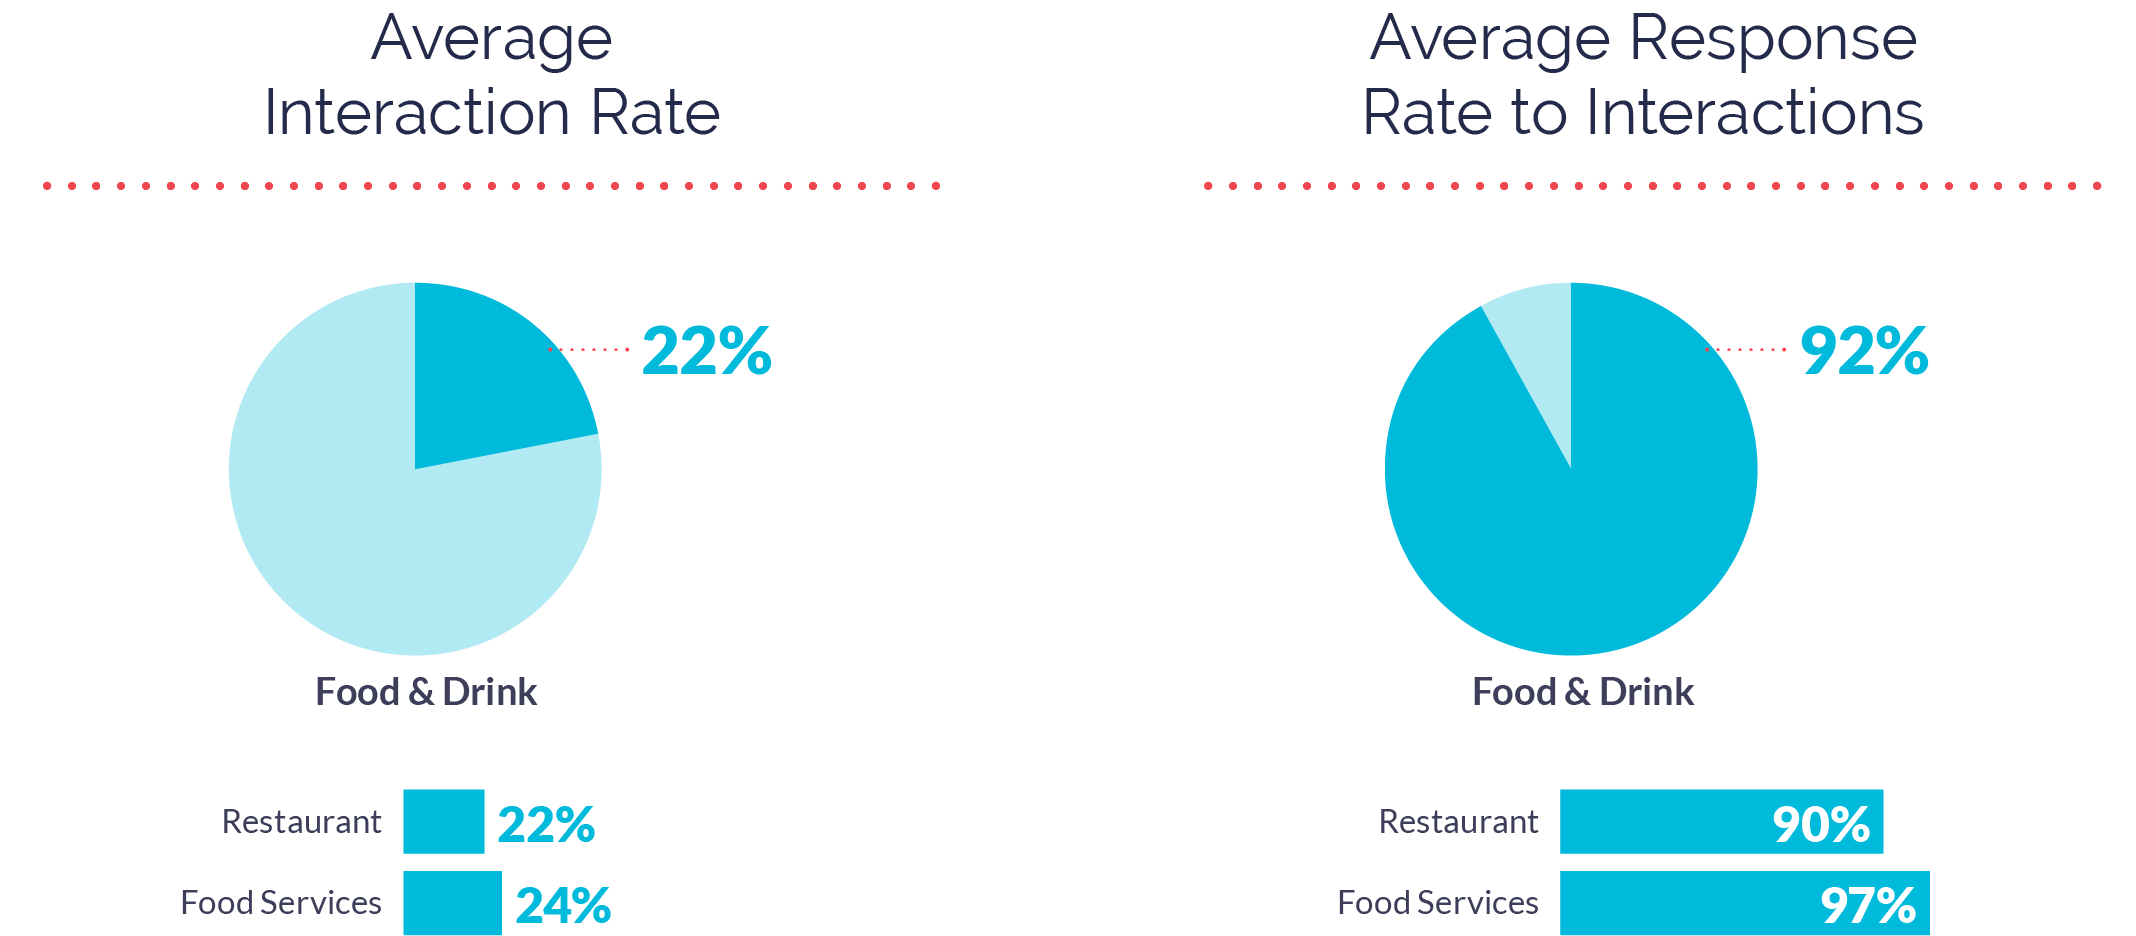
Companies in both Restaurant and Food Service used their apps to get useful information about service changes in front of consumers, embracing the shift to mobile the industry experienced. Mobile teams also kept their response rates high throughout the year (macro average was 92%)—no easy feat as the marketplace responded to unprecedented shifts in how service could be given. These teams clearly understand that when consumers reach out, responding to understand and act on emotion is the best strategy.
Surveys and Messages
As part of the increased interactions, Food and Drink apps leaned on in-app surveys to gauge consumer emotion and listen for feedback. The percentage of people prompted for surveys was higher than the macro average (25%) in both Restaurant apps (32%) and Food Services apps (44%).
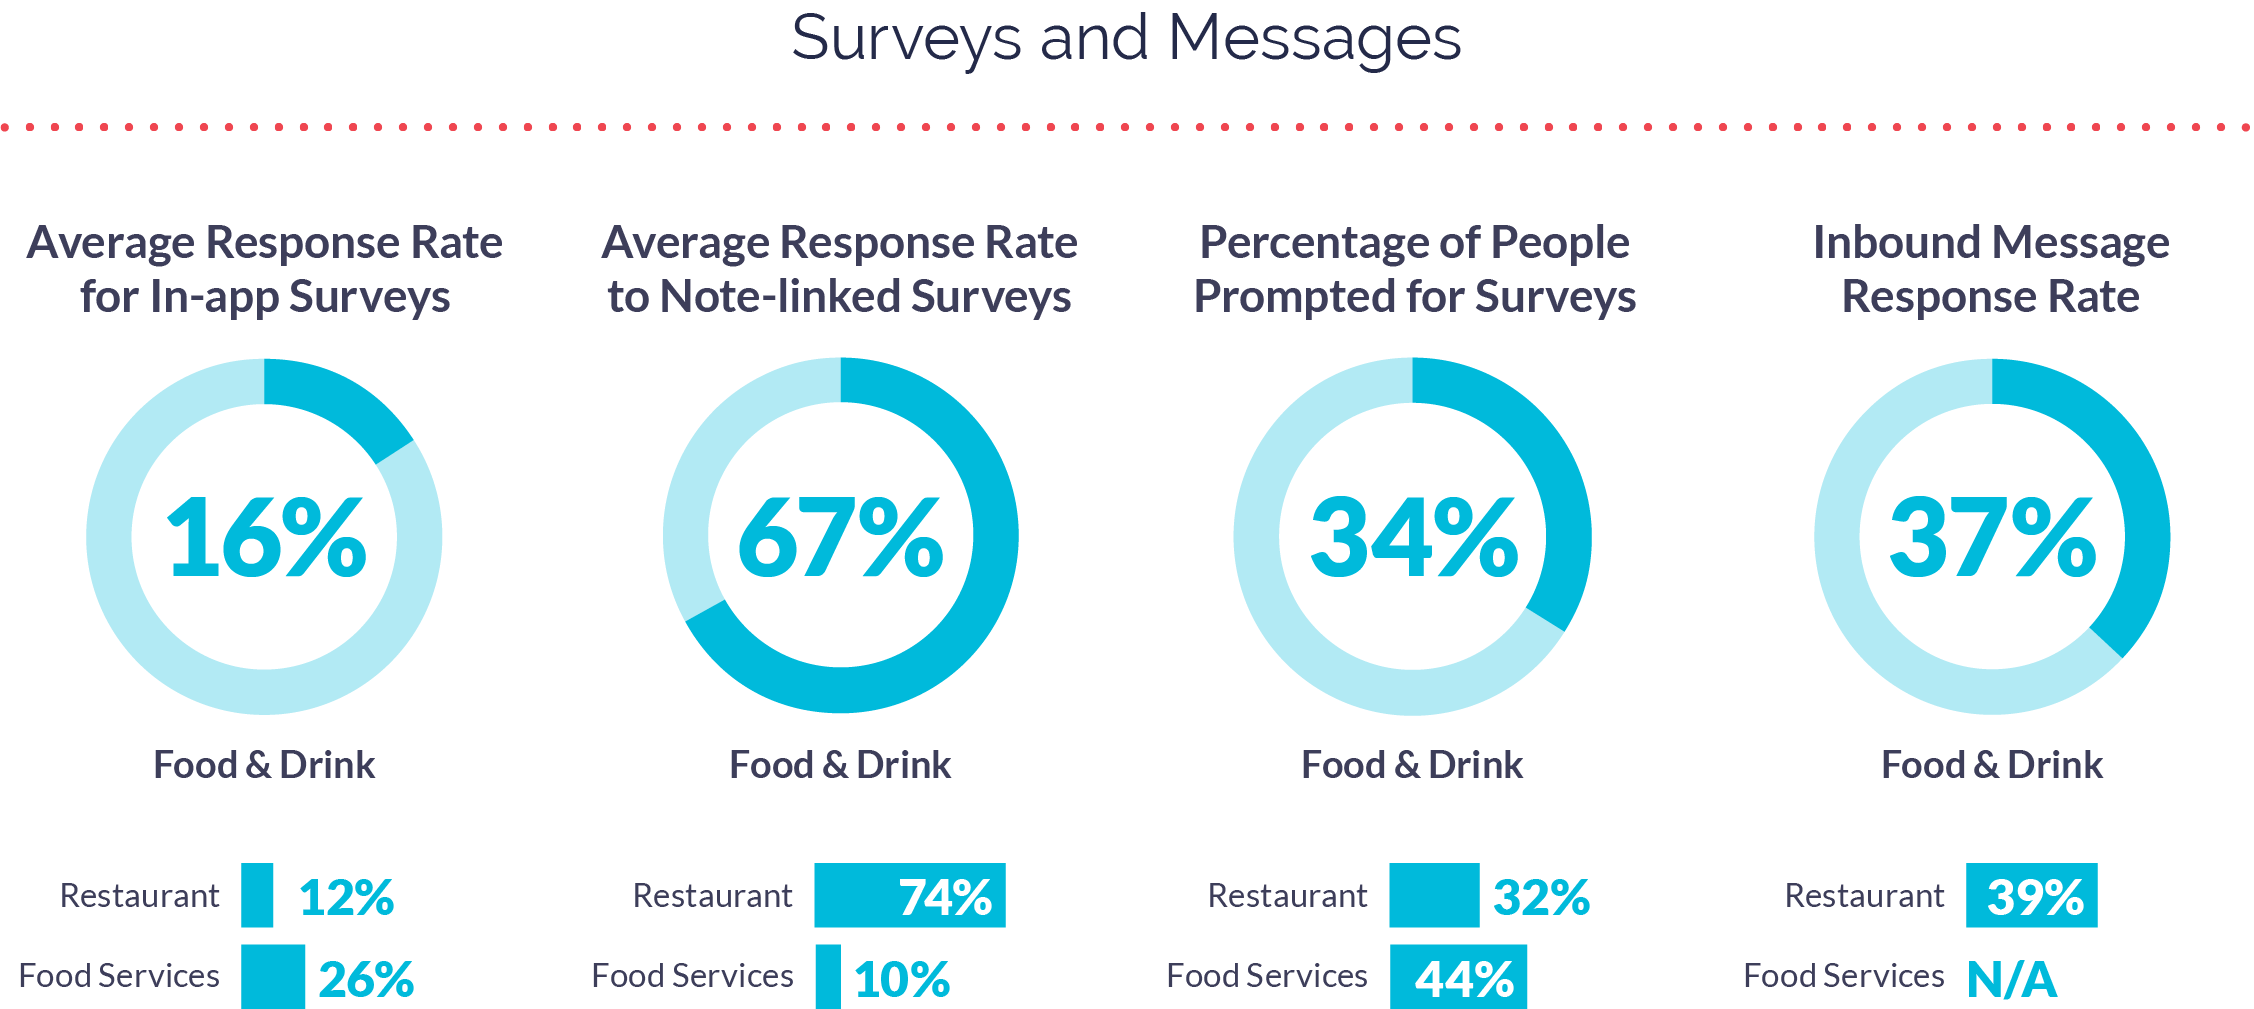
Restaurant survey responses fell slightly below the industry average at 12% (average is 16%), while Food Services was much higher at 26%.
Retention
These companies prioritized in-app consumer communication when it was one of the only—if not the only—channels available, and the results speak for themselves. Retention for Food and Drink apps didn’t take a strong hit and stayed relatively high. Average 90-day retention (43%) was slightly below the macro average of 48%. Annual retention (40%) even outperformed the macro average of 35%.
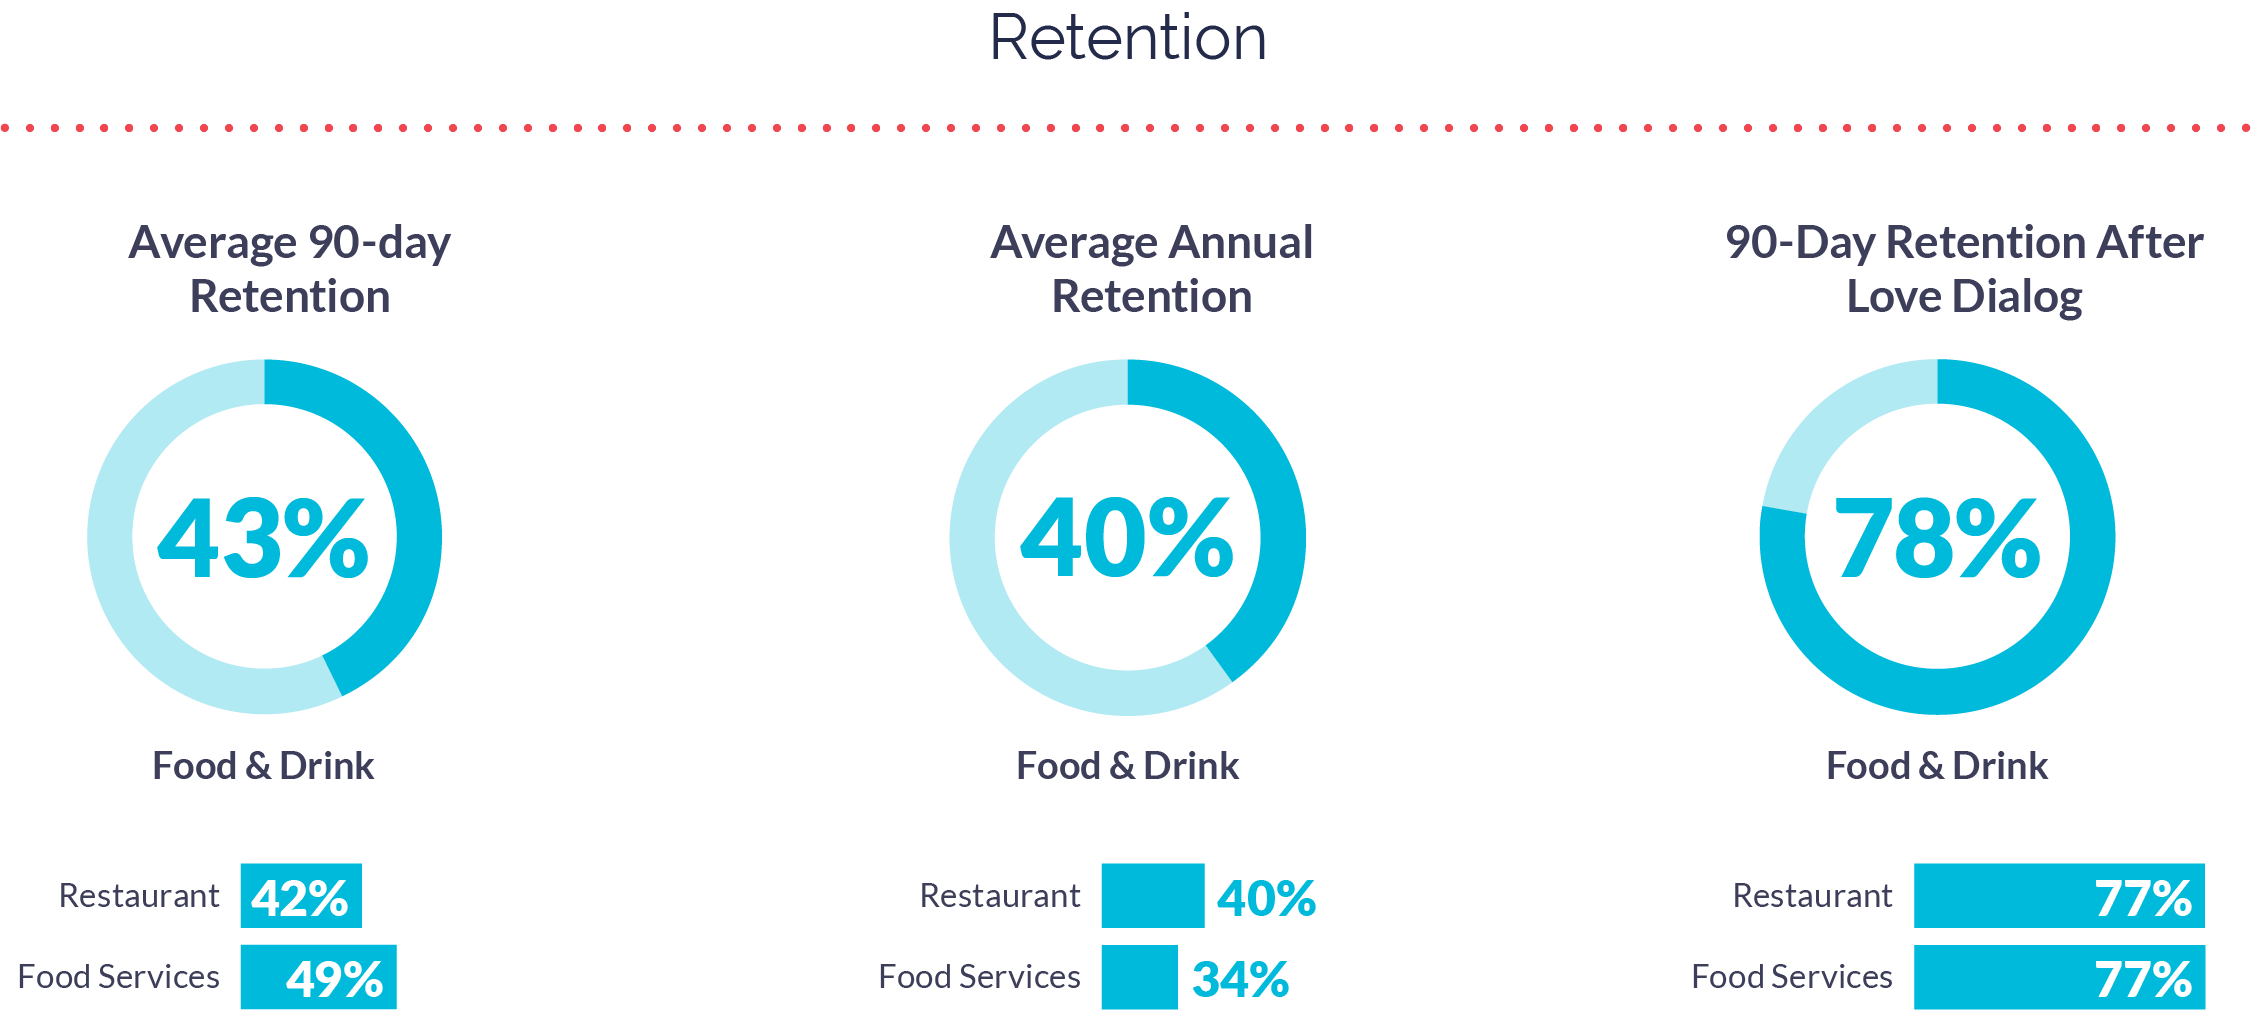
Food and Drink consumers also responded marvelously to brands who proactively asked for and acted on their feedback. Retention in both categories saw a huge increase after consumers were proactively engaged. When consumers saw a Love Dialog, their 90-day retention jumped to 77% in Restaurant (from 42%) and 77% in Food Services (from 49%).
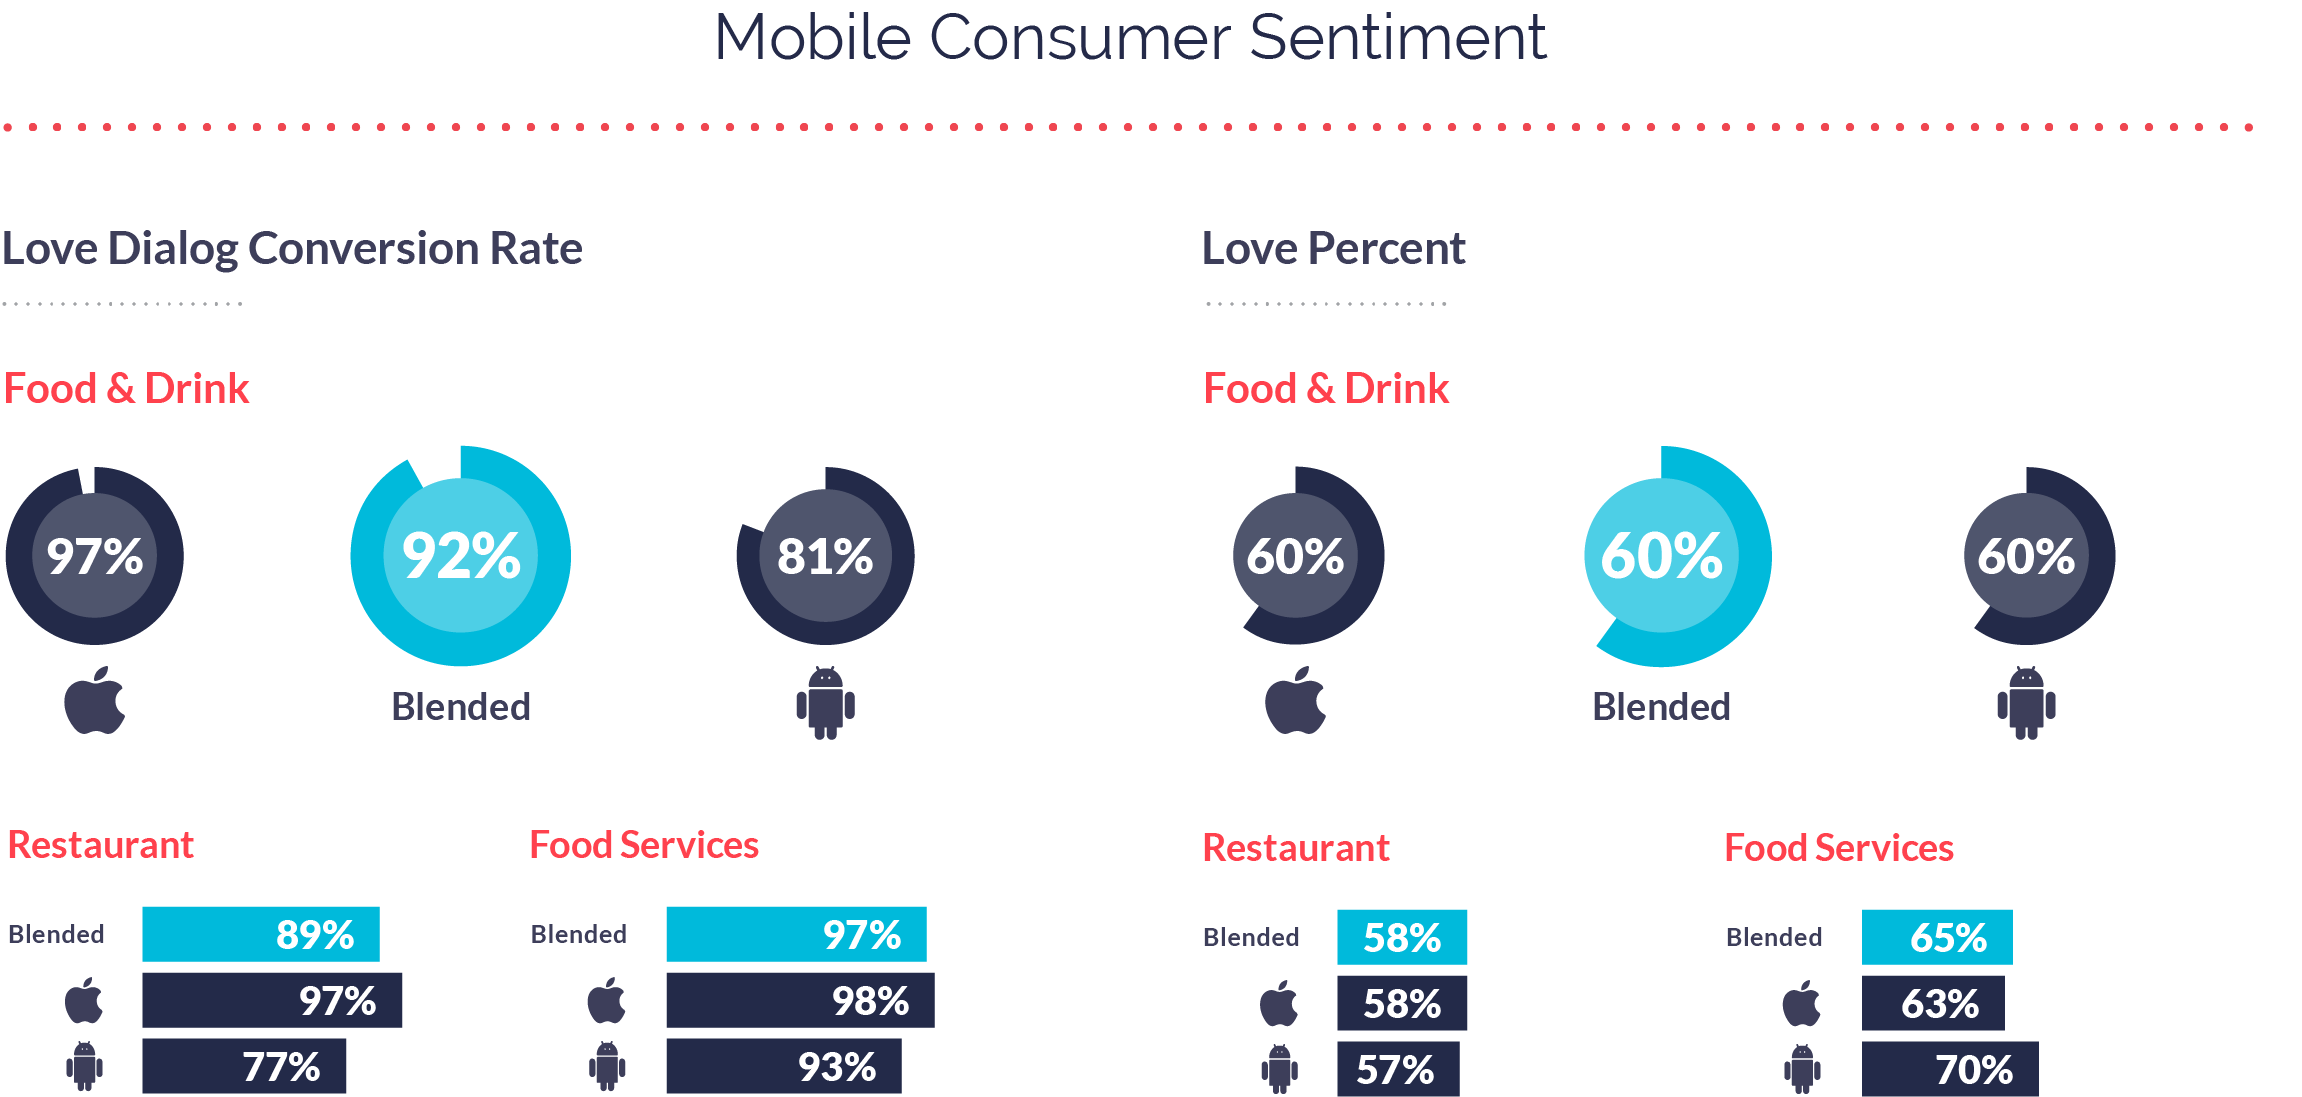
Mobile Consumer Sentiment
Gauging sentiment starts with understanding customer emotion. Alchemer Mobile (formerly Apptentive)’s Love Dialog feature is used to gather the data, which starts with a simple “yes” or “no” question: “Do you love our company?”
In 2020, 92% of consumers who were prompted by a Love Dialog responded “Yes” or “No” rather than closing out of the prompt (macro average is 93%). 60% of consumers prompted responded that “Yes,” they loved the company, which yielded a Love Percent slightly lower than the macro average of 65%.
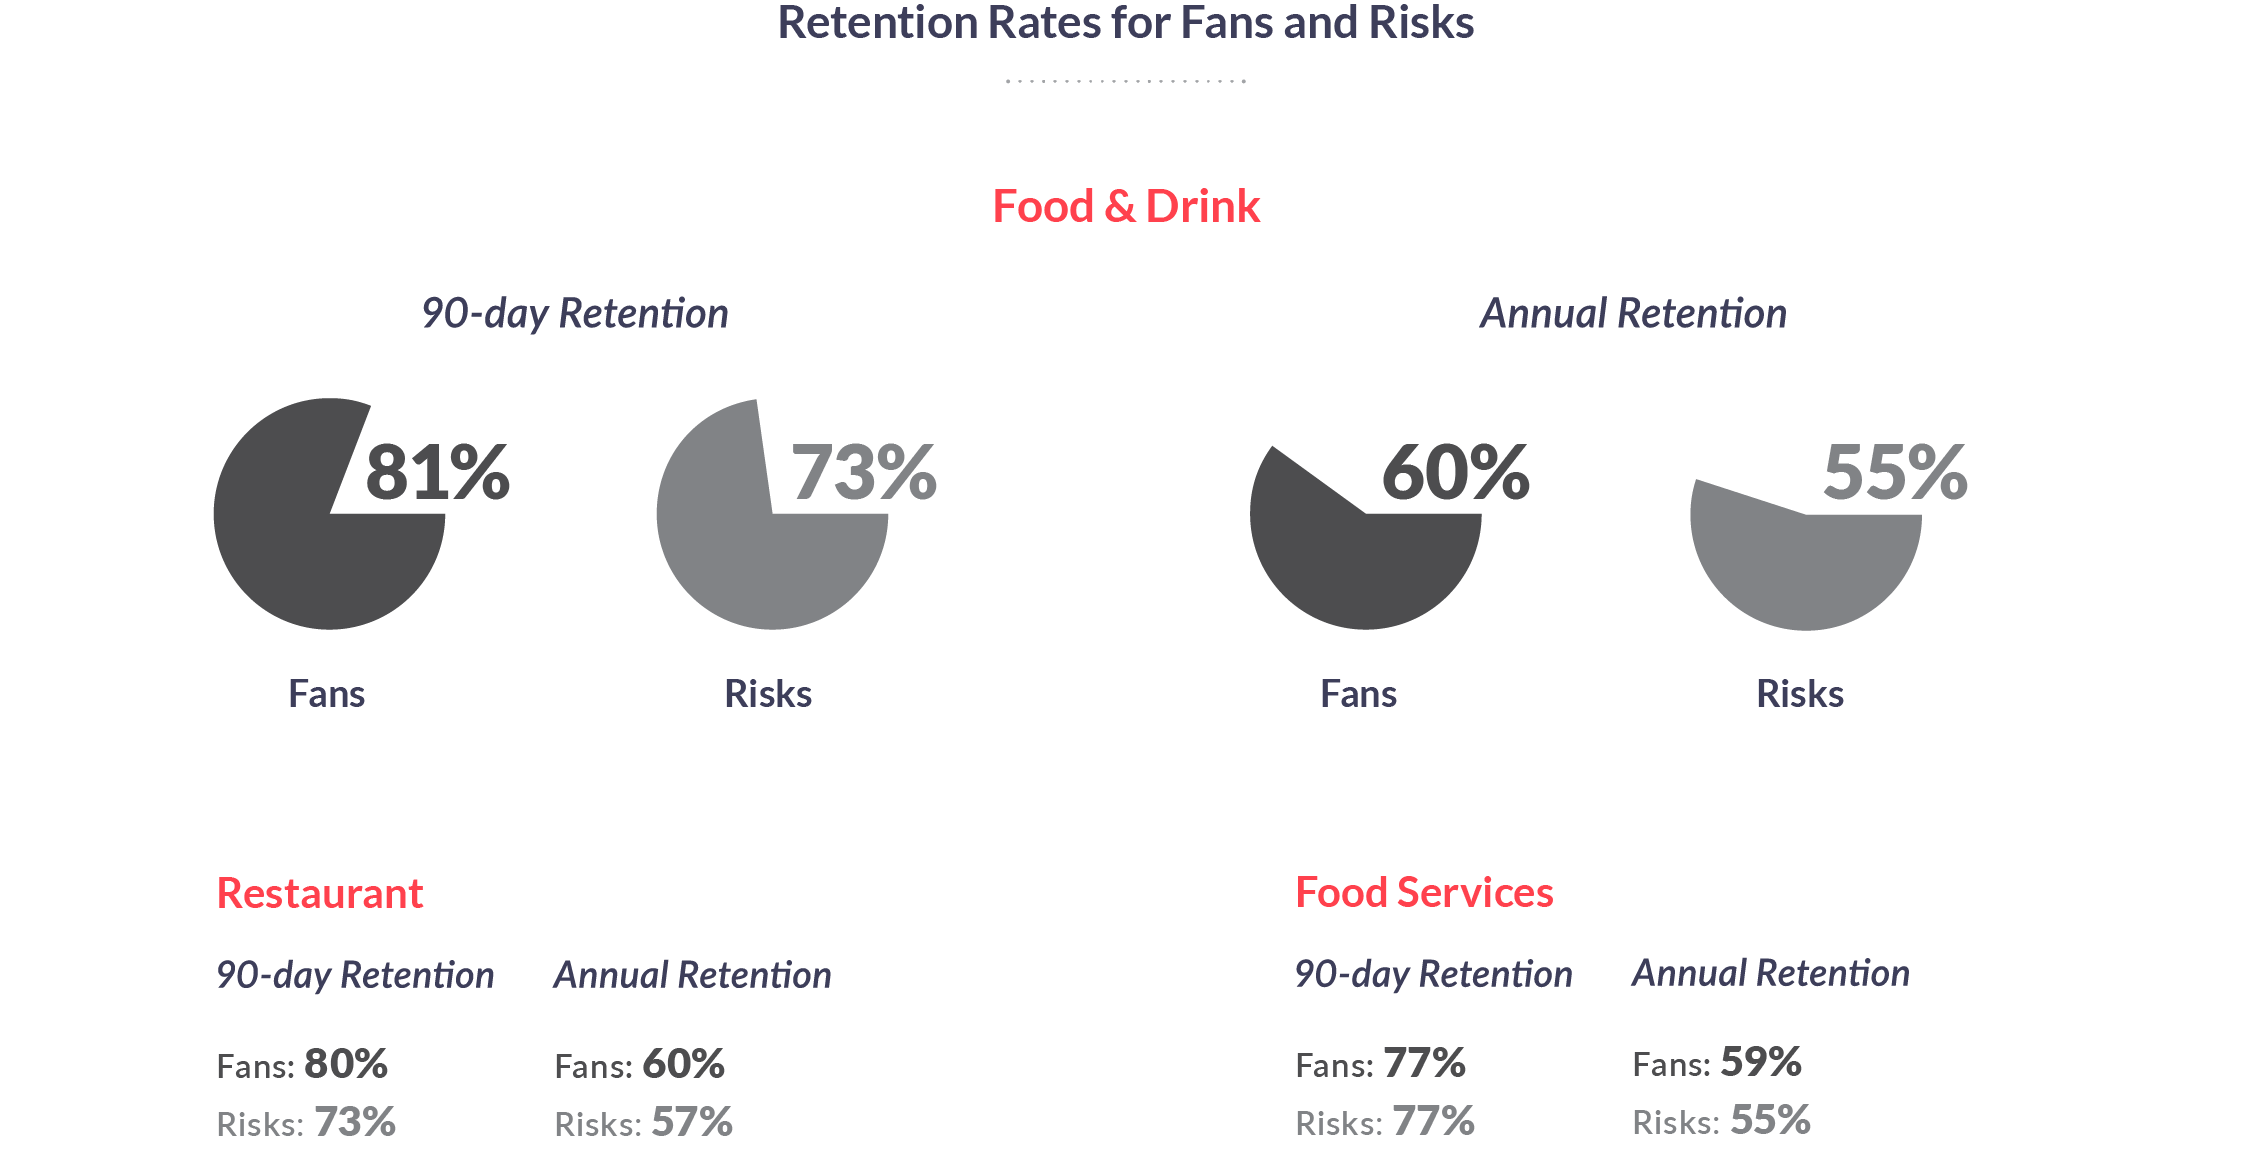
However, the retention gap between Fans and Risks broadened in Food and Drink, and Risks were more likely to churn than Fans. This was not the case at the macro level where risk of churn was almost equal for Fans and Risks. Understanding why this disparity exists and getting ahead of it is a focus area for Food and Drink mobile teams in 2021.
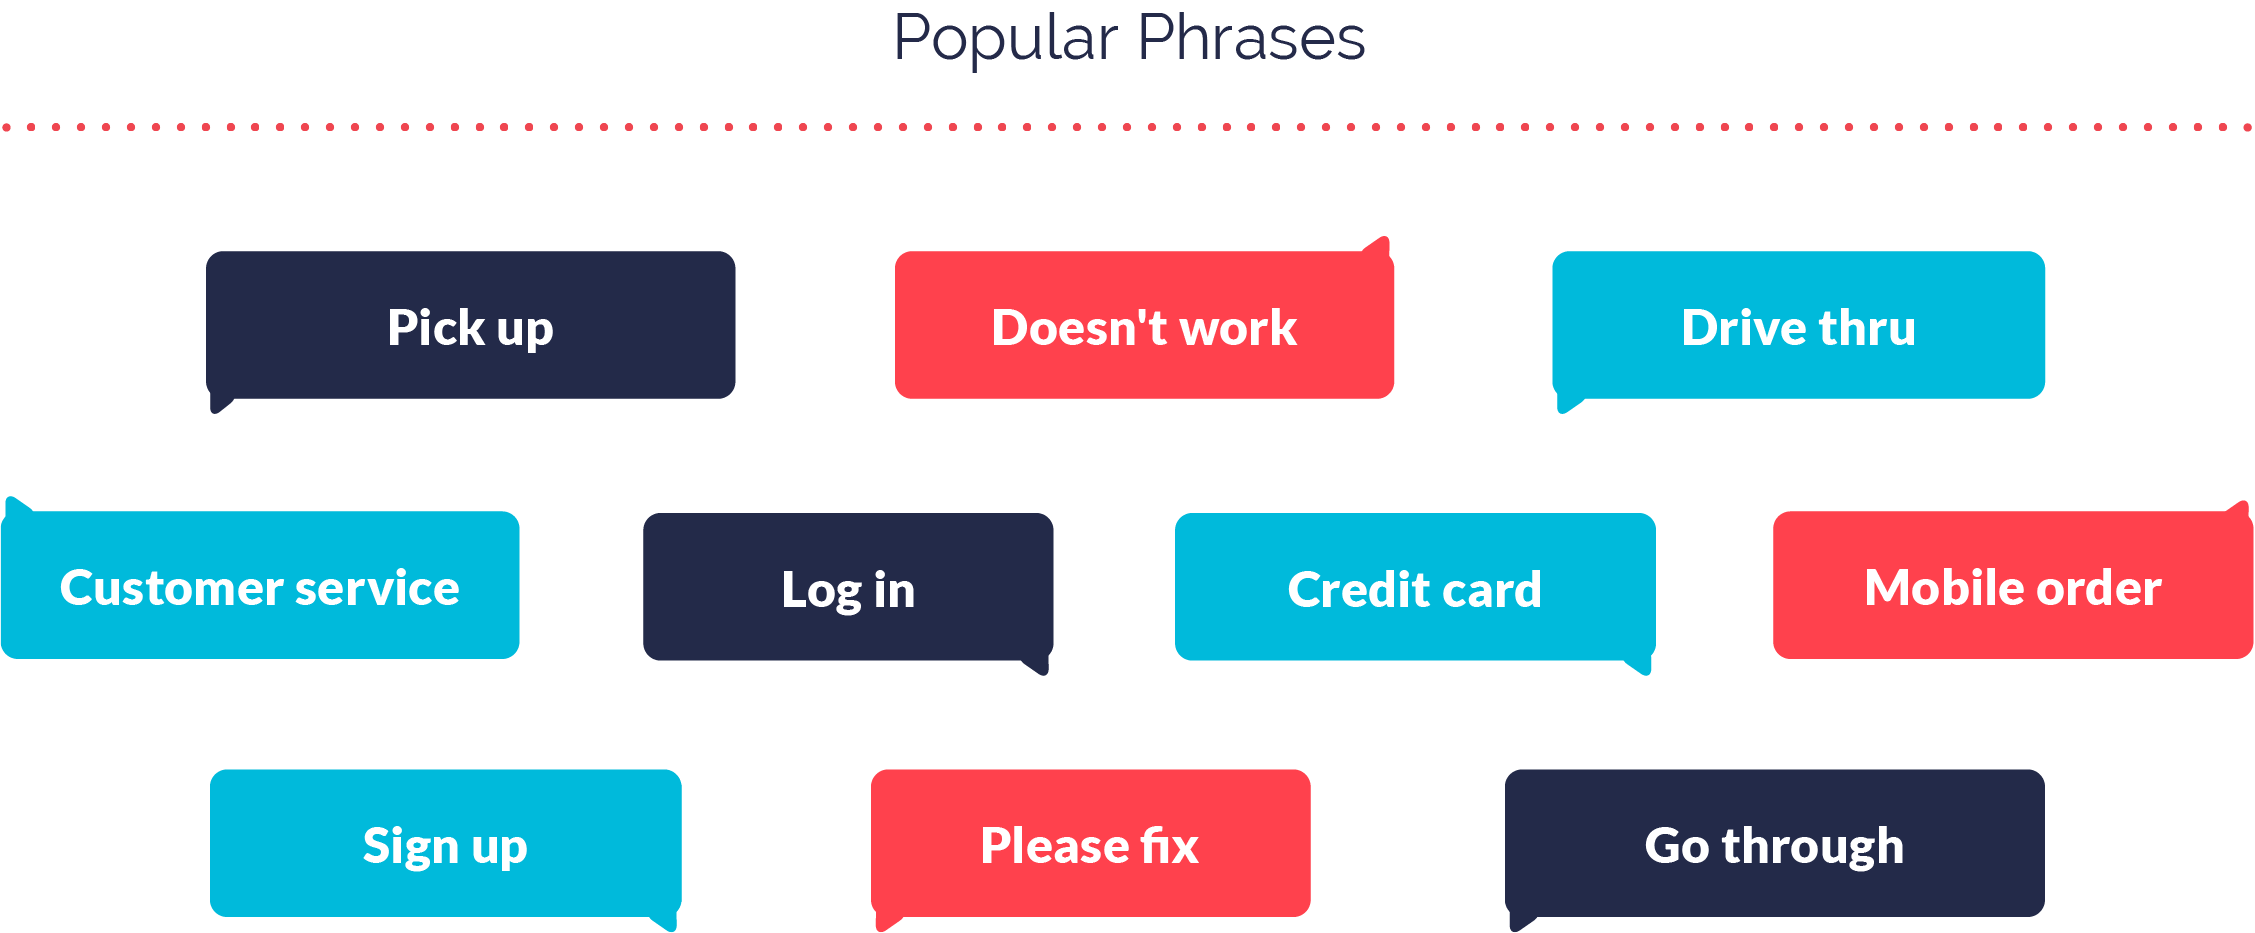
Popular Phrases
Shifting our focus to app store reviews, here are the 10 most popular phrases for both iOS and Android throughout 2020.
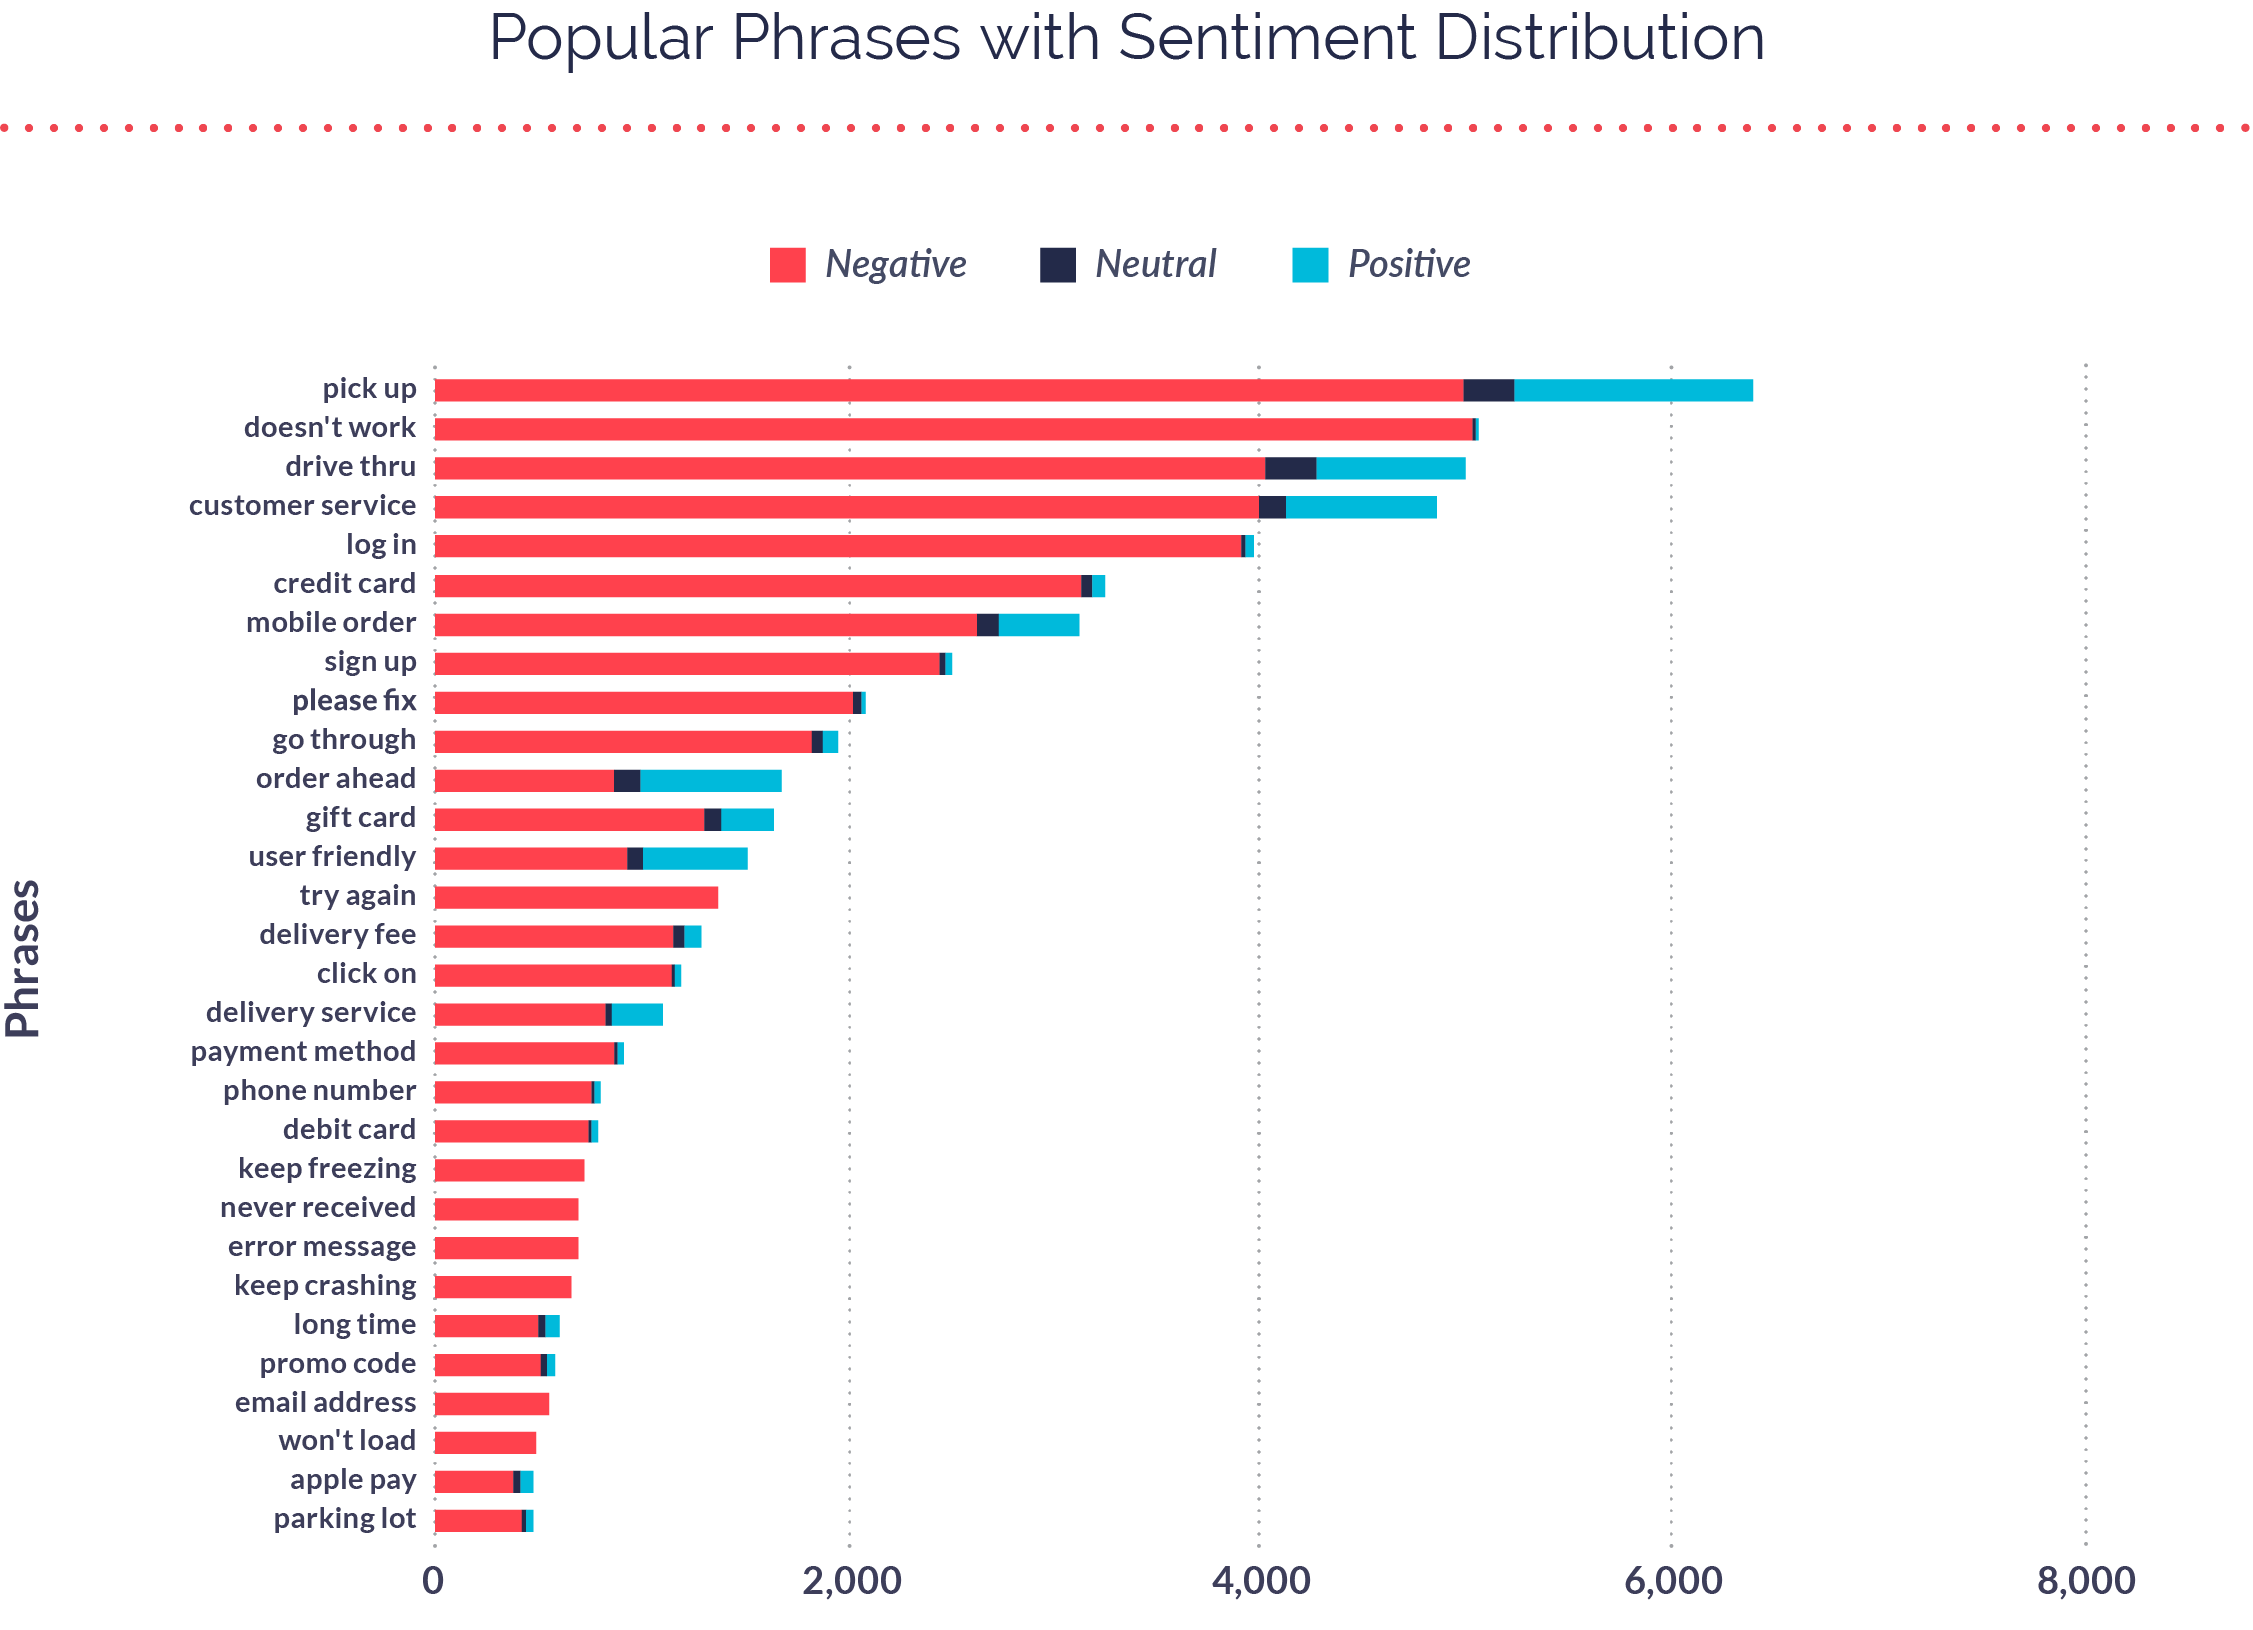
When we layer on sentiment distribution, you can see the difference between negative, neutral, and positive sentiment across app store reviews. The Food and Drink app category is especially prone to negative sentiment through reviews due to the nature of their business; it’s easy for consumers to leave frustrated feedback in the moment, and even easier for them to forget about positive experiences once they conclude.
Working in Mobile Food and Drink in 2021
As the data shows, 2020 was a turbulent year for Food and Drink businesses, but those who embraced the shift to mobile came out the other side triumphantly. As restrictions lift and consumers begin to engage with Food and Drink brands in person once again, teams must continue adjusting their digital and in-person strategies to prioritize safety, consumer comfort, and of course, revenue. Mobile will play a crucial role in this transition as it did for all of 2020.
For more on how mobile teams in Food and Drink can win back market share and improve feedback-based innovation, read our 2021 Mobile App Engagement Benchmark Report.
