The following data and information on Shopping apps is from our 2022 Mobile App Customer Engagement Report.
Subcategories for Shopping Apps: eCommerce and Retail
Pandemic-driven lockdowns drove hoards of new consumers into mobile Shopping apps in 2020, and in 2021, many stayed in mobile experiences rather than going back to in-person shopping. Mobile teams rose to the challenge by testing new ways to engage the increased number of consumers in their apps. In a herculean effort to combat painful global supply chain issues outside of their control, coupled with meeting mobile consumer expectations that stayed high from 2020, they still managed to pull off high benchmarks for Love Percent, retention, response rates, and more.
“Buy Online, Pick-up in Store provides our highest satisfaction customer experience, which in turn drives more return visits. It is also our most profitable customer journey. For example, the average customer that shops across both banners, in-store and online, spends over 12 times more than a customer utilizing a single channel,” Erik Nordstrom, CEO of Nordstrom
 Data included:
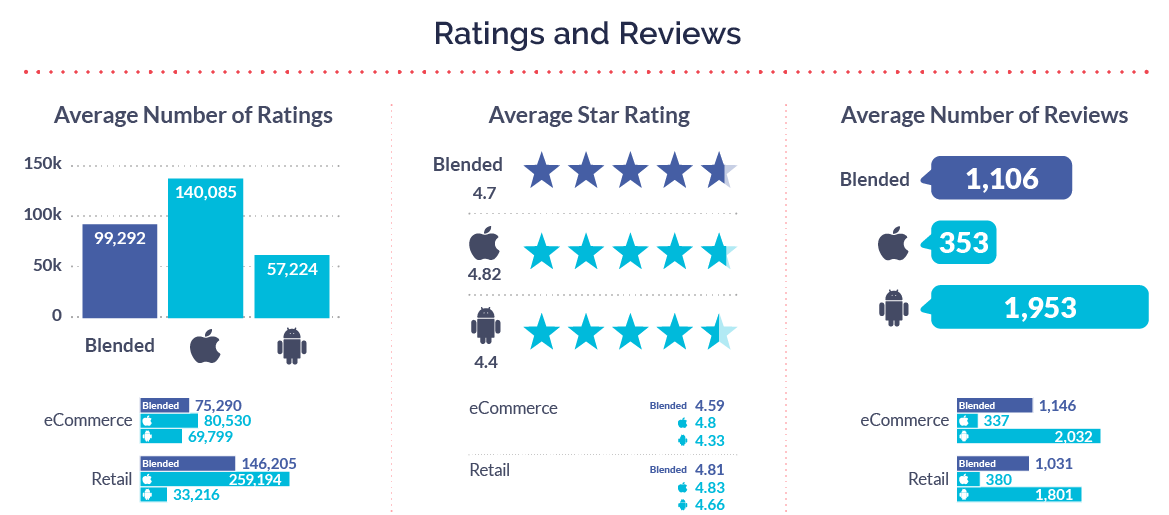
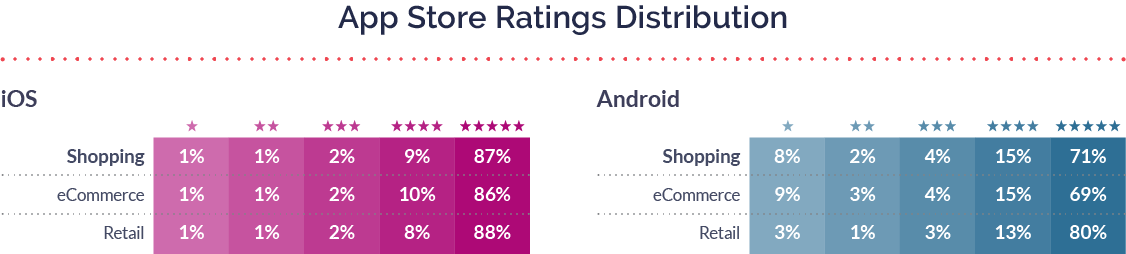
- Ratings and reviews
- Retention
- Interaction and response rates
- Surveys
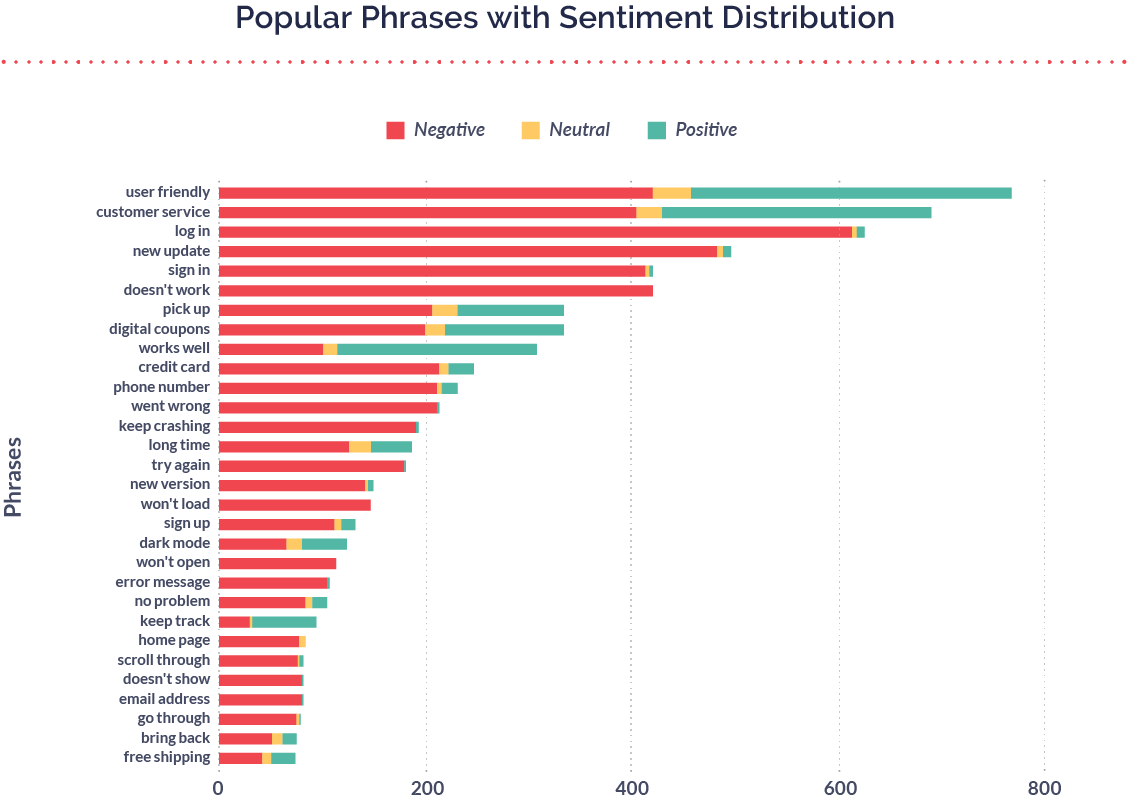
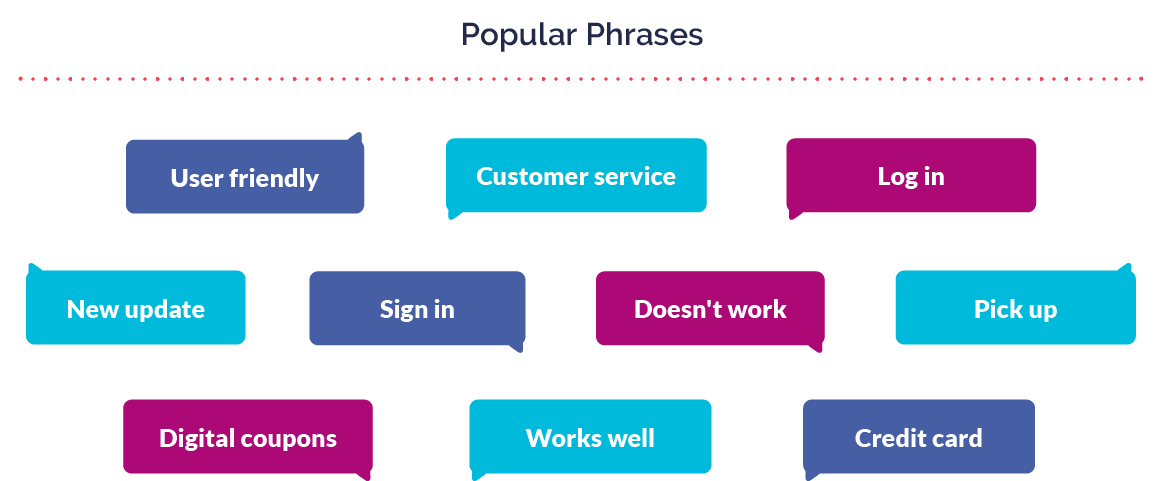
- Popular phrases
- Popular phrases with sentiment distribution
- Consumer sentiment
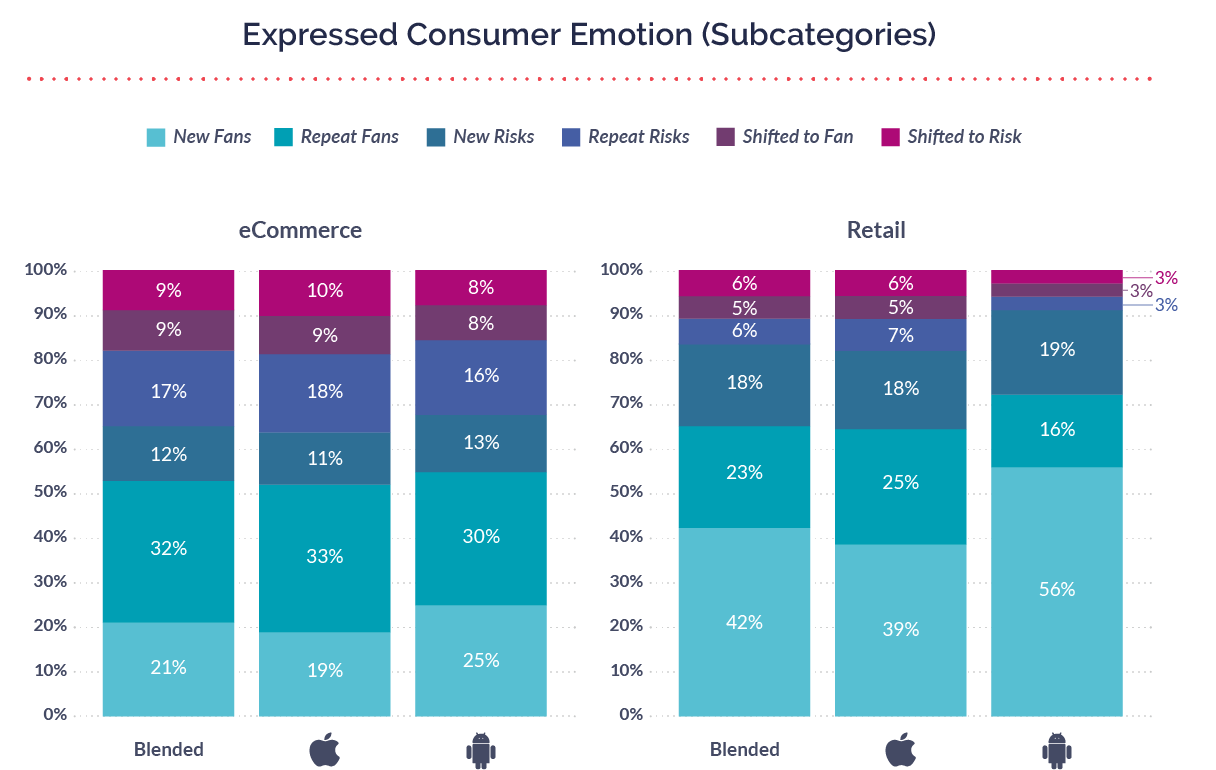
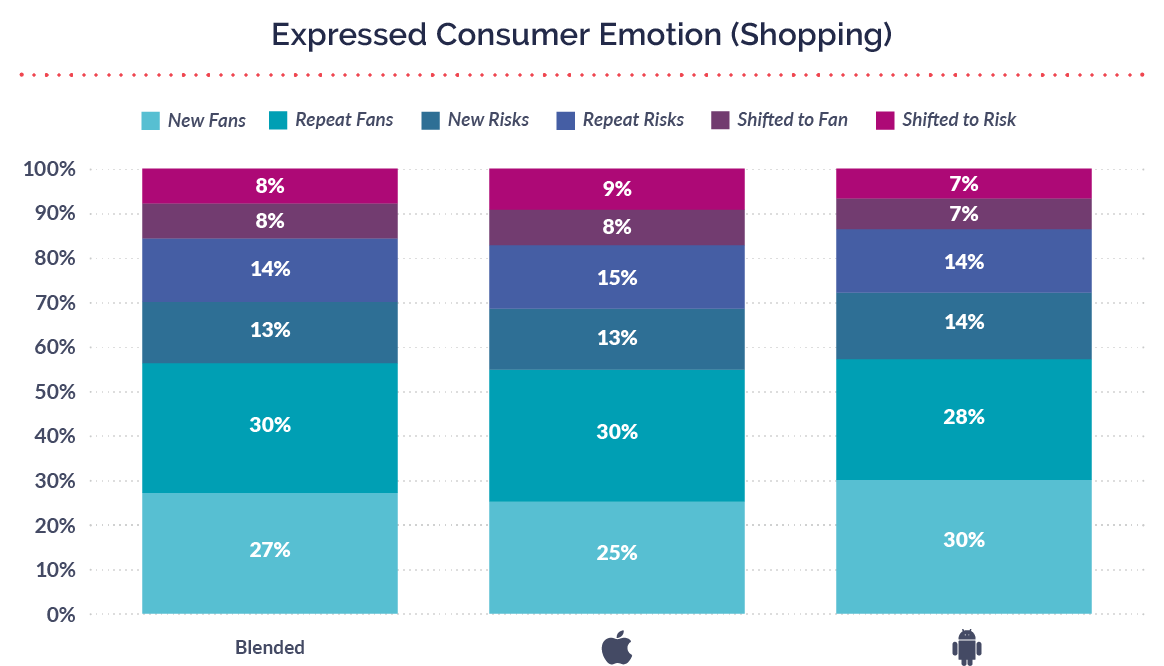
- Expressed customer emotion
- Shifted emotions
- Expressed consumer sentiment by subcategory
- Shifted emotions by subcategory
- Retention rates for Fans and Risks
→DOWNLOAD THE FULL 2022 BENCHMARK REPORT HERE
Summary of Shopping Apps in 2021
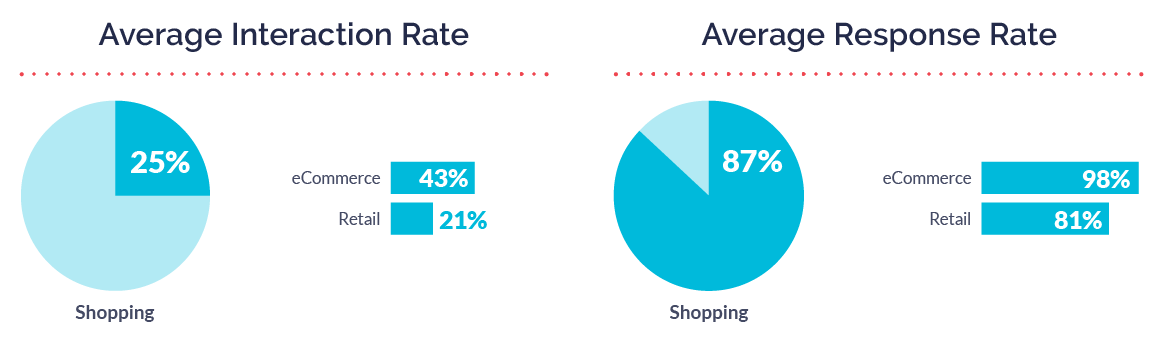
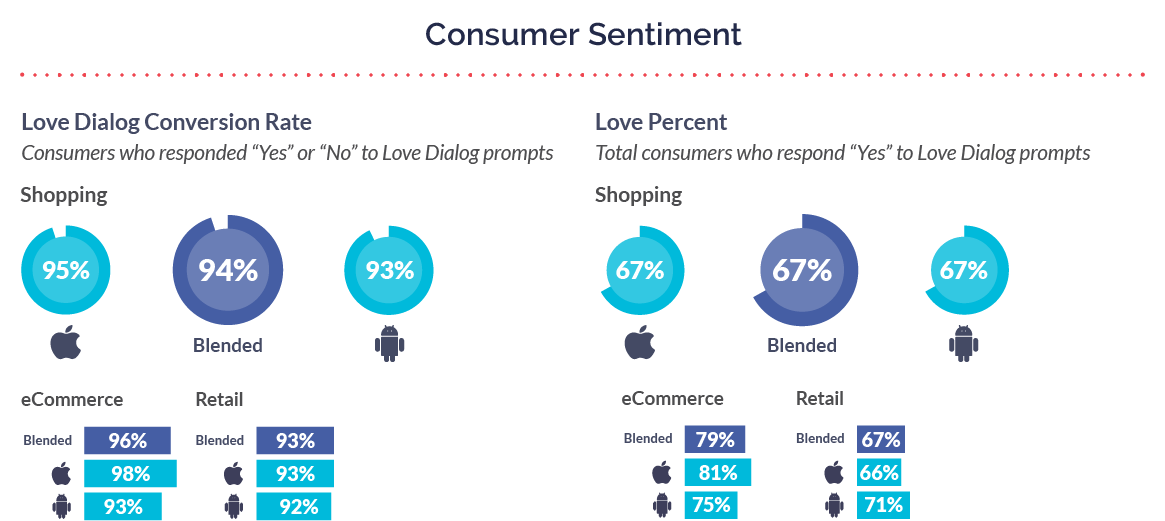
The average interaction rate was average for Retail at 21% (26% overall), but was high for eCommerce at 43%. eCommerce brands were in a boon last year, and they capitalized on engaging with the increased volume of consumers through their mobile experiences. Consumers gladly welcomed the increase in interactions as the average response rate for eCommerce apps made us do a double-take at 98%—meaning almost every single consumer prompted responded. Retail was lower at 81%.
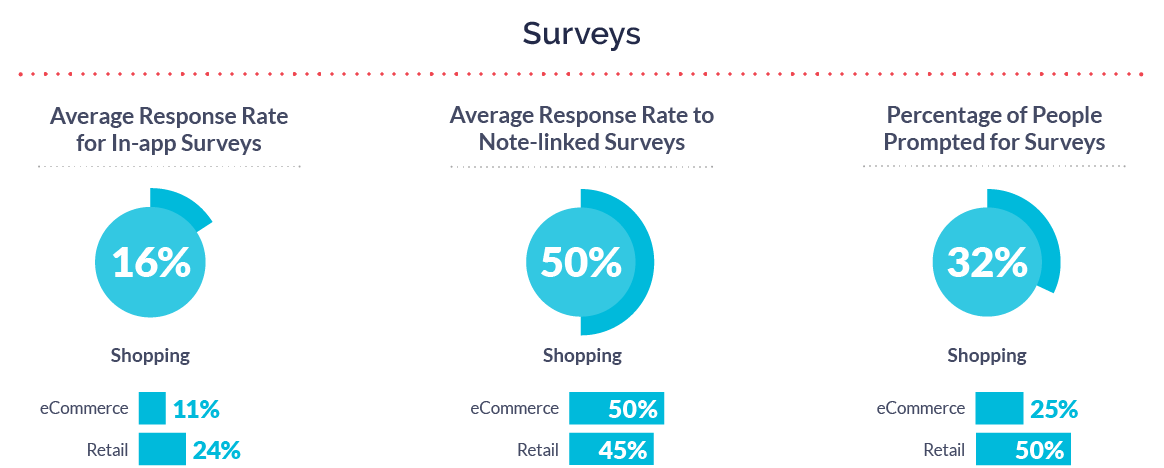
One interaction Shopping apps used to attain such high retention rates was surveys, used to regularly touch base with consumers. The percentage of people prompted for surveys in eCommerce was 25% (28% overall); Retail was exceptional at 50%. As a result, survey response rates were 11% for eCommerce (13% overall)—and an astounding 24% for Retail. Competition in mobile shopping is fierce, and the best way for teams to stay ahead is to hear from more consumers, particularly throughout a year of delayed shipments and increased wait times.
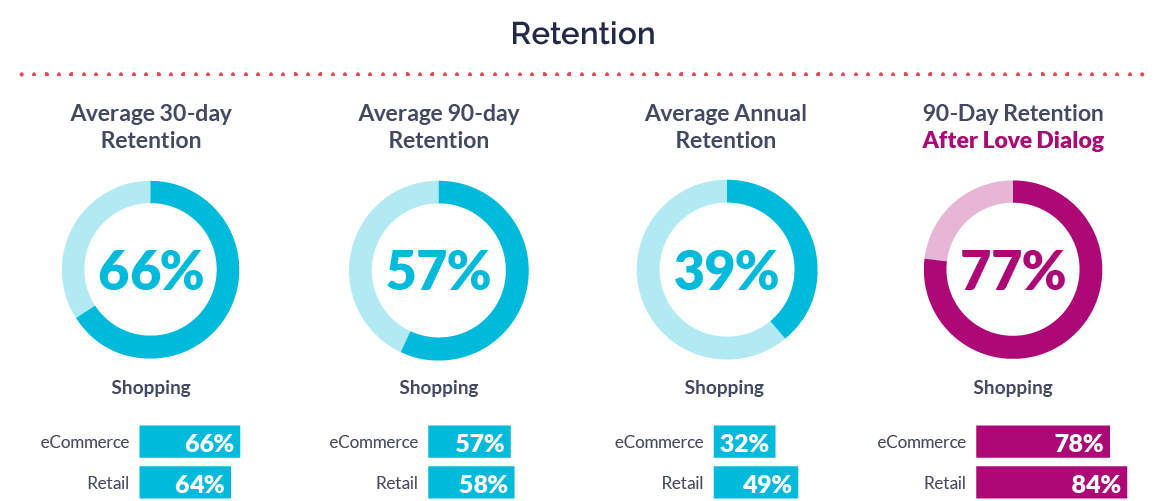
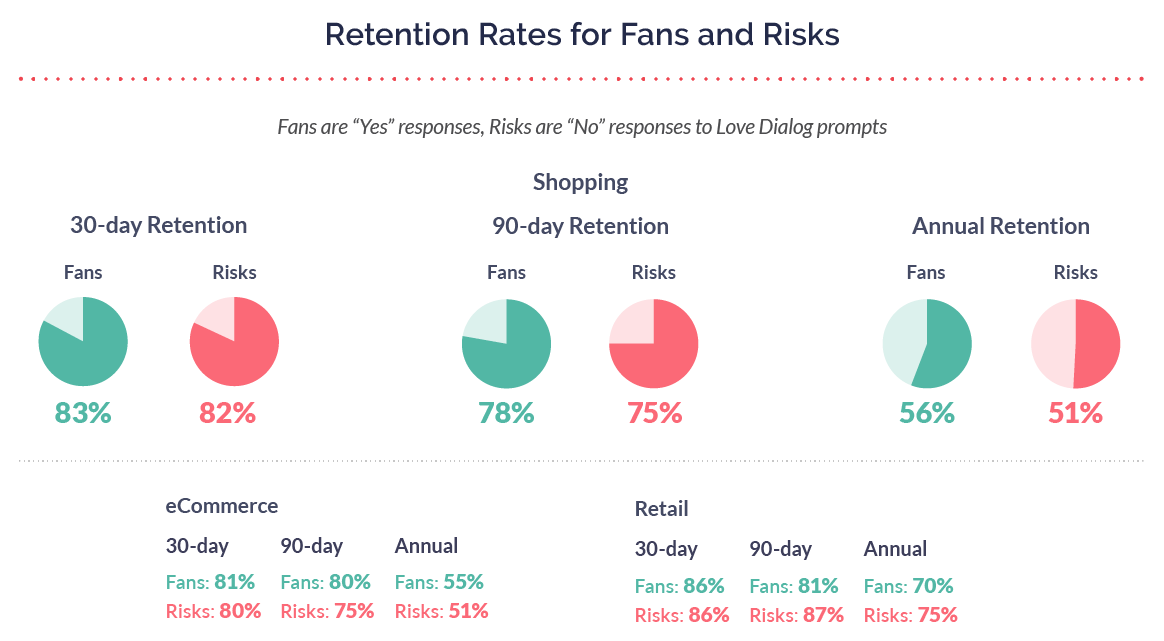
These new interactions led to improved retention throughout the year, with benchmarks of 66% 30-day, 57% 90-day, and 39% annual. Notably, eCommerce apps saw a 10% increase in annual retention year-over-year. 90-day retention after Love Dialog was high for both subcategories: eCommerce at 78% and Retail at 84% (79% overall average). Retention rates for Fans and Risks aligned, even though they were slightly below macro averages. Ease of change for consumers in Shopping apps is high because the marketplace is so competitive. Consumers have a lot of choices when it comes to shopping, and talking to them before they leave resulted in success.
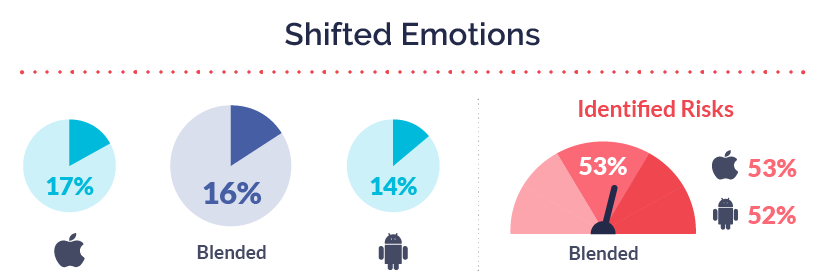
A final win for Shopping apps is that, collectively, only 11% of consumers shifted their emotions throughout the year (14% overall), and Fans outpaced Risks in both Retail and eCommerce. Shopping brands used Love Percent to understand the pulse of consumer sentiment over time, and Love Percent for Retail was 67%, 79% for eCommerce (64% overall). Within Love Percent, eCommerce saw a 23% year-over-year increase, which is a direct result of talking to more of their consumers. When brands talk to more people, they get a more realistic picture of sentiment; in this case, consumers’ responses were more positive.

Bonus reading and resources
- How Mobile Customer Loyalty Programs Increase Customer Retention and Drive Revenue (with Examples)
- Tough Love Tuesday: How Zola can Improve Mobile Customer Retention
- How to Hit a Home Run with In-app Mobile Ordering Experiences and Avoid Striking Out with Customers
- Buy Online, Pick Up in Store (BOPIS) Isn’t Going Anywhere – Here’s How to Adjust Your Customer Experience
- Gap Inc. Q&A: Leveraging Mobile Customer Feedback to Drive Business Decisions
- Improve Your Curbside Pickup Experience with In-app Mobile Surveys
- The Best Customer Experience Examples in Retail & Shopping
- Why Retail and Shopping Apps Need to Embrace Qualitative Feedback
- Why Mobile-Only Coupons, Promos, and Deals Increase App Engagement
Want to see how the Shopping category compares to the macro trends we identified in our 2022 Mobile Customer Engagement Report? Download your copy here.
Additional visual benchmark data for Shopping apps