COVID-19 has undeniably impacted your app, industry, and competitors. In a matter of weeks, consumers had to adapt to an entirely new, digital reality — and mobile became the lifeline for activities and purchases even for those who were skeptical of its value.
Our team looked at how COVID-19 has impacted mobile app usage patterns over the past three months by industry. This article outlines our findings and ends with a playbook to help you understand exactly what these changes mean for your app, based on real customer feedback and sentiment.
Key findings from our research include:
- Looking at DAU over time is the best way to understand drastic changes in app usage.
- Almost all apps have experienced one of three significant changes to their DAU due to COVID-19: massive drops, huge spikes, or higher frequency of app usage.
- For apps in the hardest hit industries, DAU is down 60-75%.
- For apps in industries that have fared well, DAU is up over 200%.
*The data used throughout this post is from anonymized, US-based Alchemer Mobile (formerly Apptentive) customers’ iOS apps. For additional COVID-19 resources, see our dedicated hub for the latest marketplace news, tips, and feature suggestions.
Daily Active Users: The Top of the Funnel
The best place to start understanding trends is by looking at the total number of unique customers that use your app on a given day, or Daily Active Users (DAU). Although Monthly Active Users (MAU) is typically a more commonplace metric for understanding customer usage patterns in mobile apps, in times like this, we need to look at more granular data.
DAU and MAU are related, but DAU offers you a much better glimpse into trends on a daily basis whereas it can take months to see a substantial change in MAU — if one is seen at all. Looking at DAU over time is the best way to understand drastic changes in app usage, which is a common theme we’ve seen across all industries since COVID-19 hit. DAU is an important metric because it serves as the “top of the funnel” to understand any deeper trends within your app. Understanding changes in your DAU helps you tell the beginning of the story of how COVID-19 has impacted your apps.
Imagine that you have a retail app and you’ve noticed that certain order types have greatly increased. To fully understand what these orders mean for your business, you’ll need to look at them in relation to your total customer base or DAU. For example, what caused orders to spike? Is it because there are 100k more customers using your app each day (DAU is up)? Or maybe you even have fewer customers using your app (DAU is down), but each of those customers is making a much larger order?
Almost all of our customers’ apps have experienced a significant change in their DAU due to COVID-19. There are three main trends taking place:
- Massive drops. For example, an app that has regularly had five million Daily Active Users drops to one million.
- Huge spikes. Some apps have had their DAU go up by over 500%, and often, it happened in only a matter of days.
- Higher frequency of app usage. For example, apps that historically seen predictable weekly trends in usage are now seeing entirely new patterns.
Next, let’s take a high level look at how those changes play out on the ground.
Trends Across App Store Categories vs. Industries
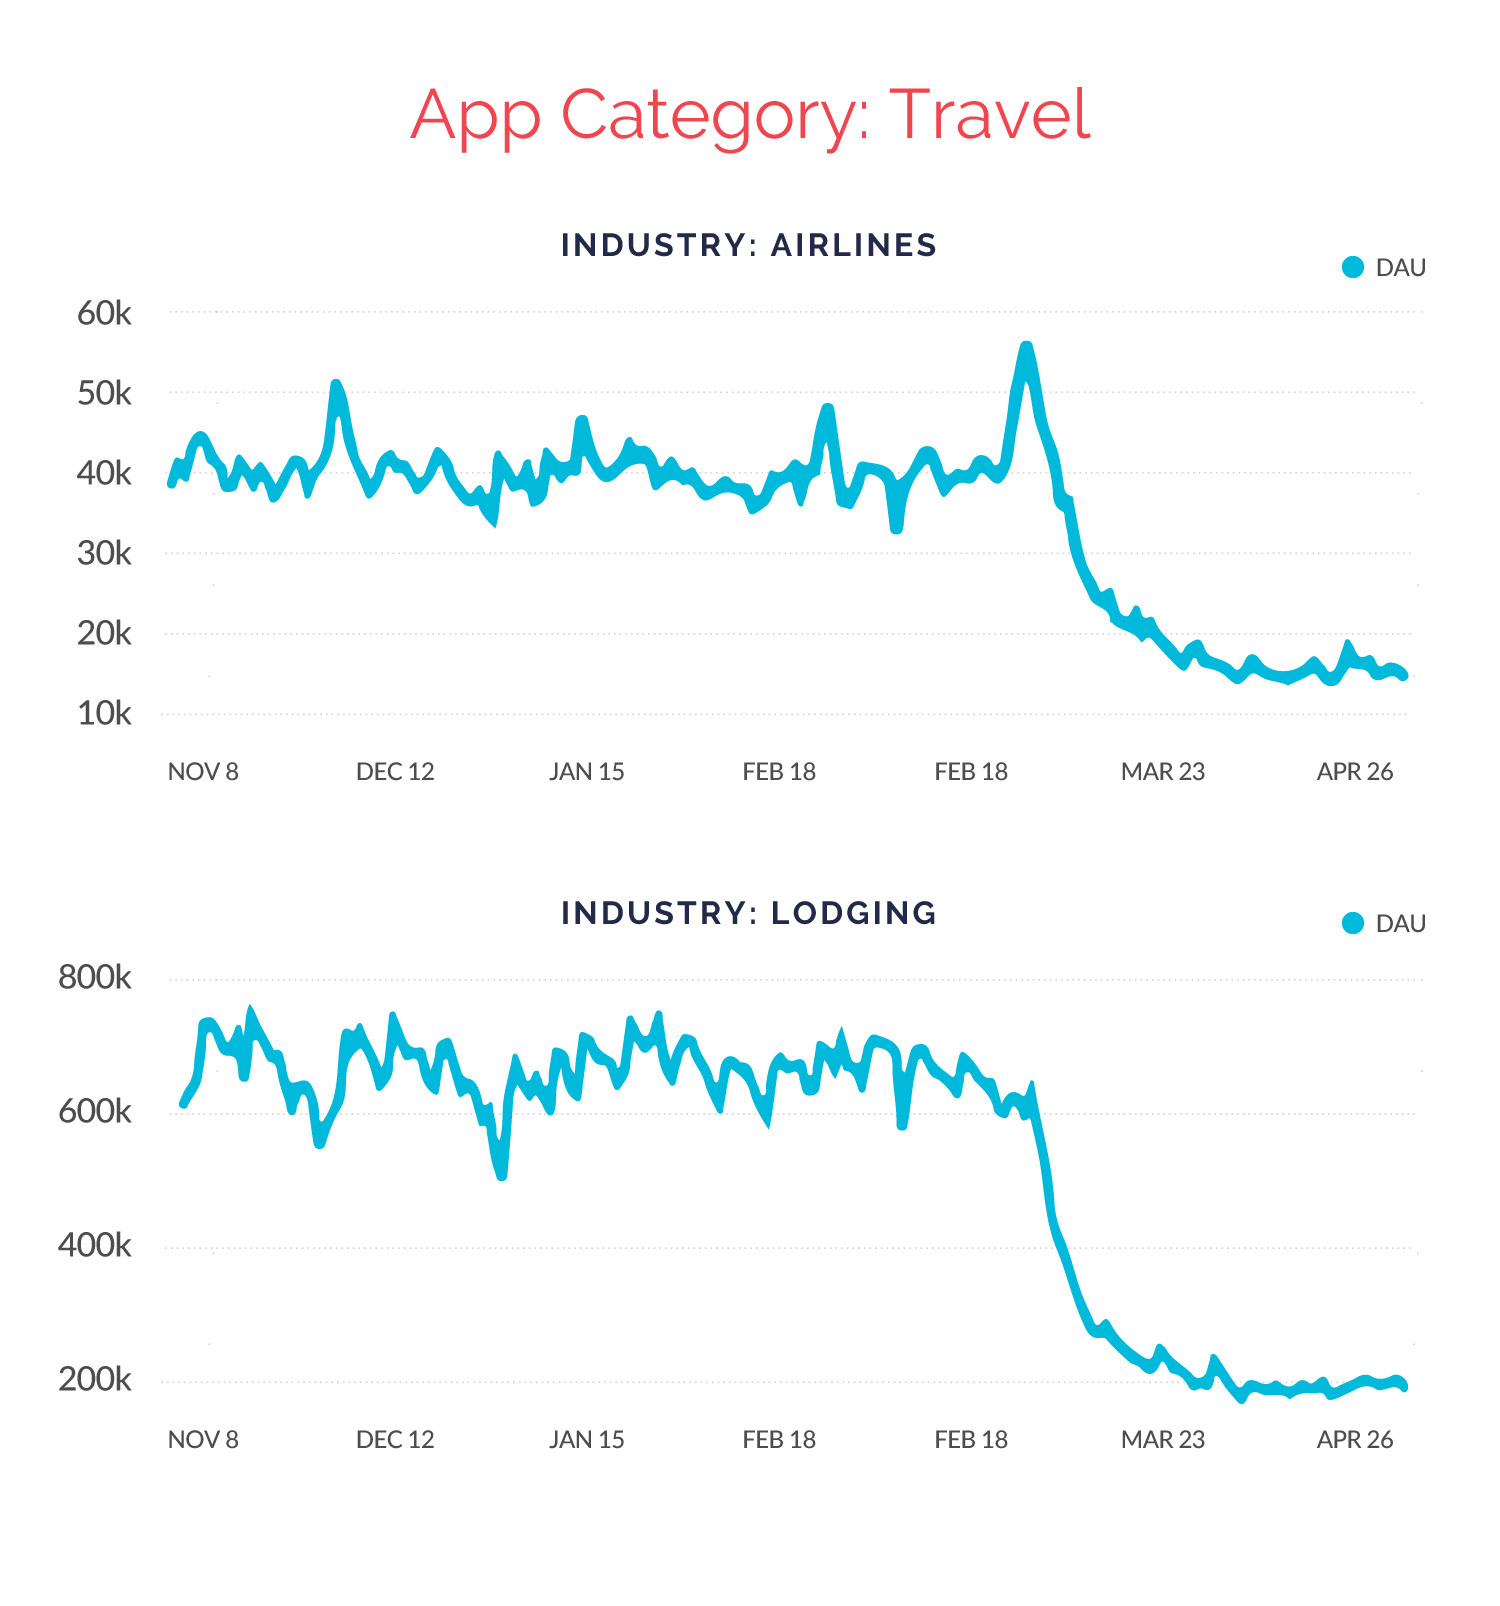
For most mobile analytics, we’re taught to look at results by app store category. After all, these are the other apps that you’re competing with for downloads, be it directly or indirectly. In some cases, analyzing DAU by app store category can tell us a relevant story. The most clear example of this is the Travel category, which has seen a drastic decline in DAU across the board, whether you are an airline, lodging, or restaurant ratings app.
But in most other cases, app category does not tell a complete story. The app store categories are simply too large, and a single category often encompasses apps that are experiencing totally different trends. We need more granularity to understand these trends, and for that reason, we’ve broken down the DAU trends further, into what we’re calling “industries.”
For example, the Retail app store category includes both clothing shopping apps which have often seen declines in DAU as well as online grocery ordering apps — which are seeing among the highest spikes in DAU of any apps on the market. If we were to average these out, it would obscure the very different stories that each data set tells us.
Category: Travel
Below, you see two apps in the Travel category, but the industries are different. The first app is an airline, which has seen a massive drop in DAU. The second is an app in the lodging industry, which has also seen a massive DAU drop, but spread differently week-over-week. The data tells us that the lodging industry was impacted more quickly than the airline industry as COVID-19 began to take hold in the US, even though both industries were hit hard.
Category: Food & Drink
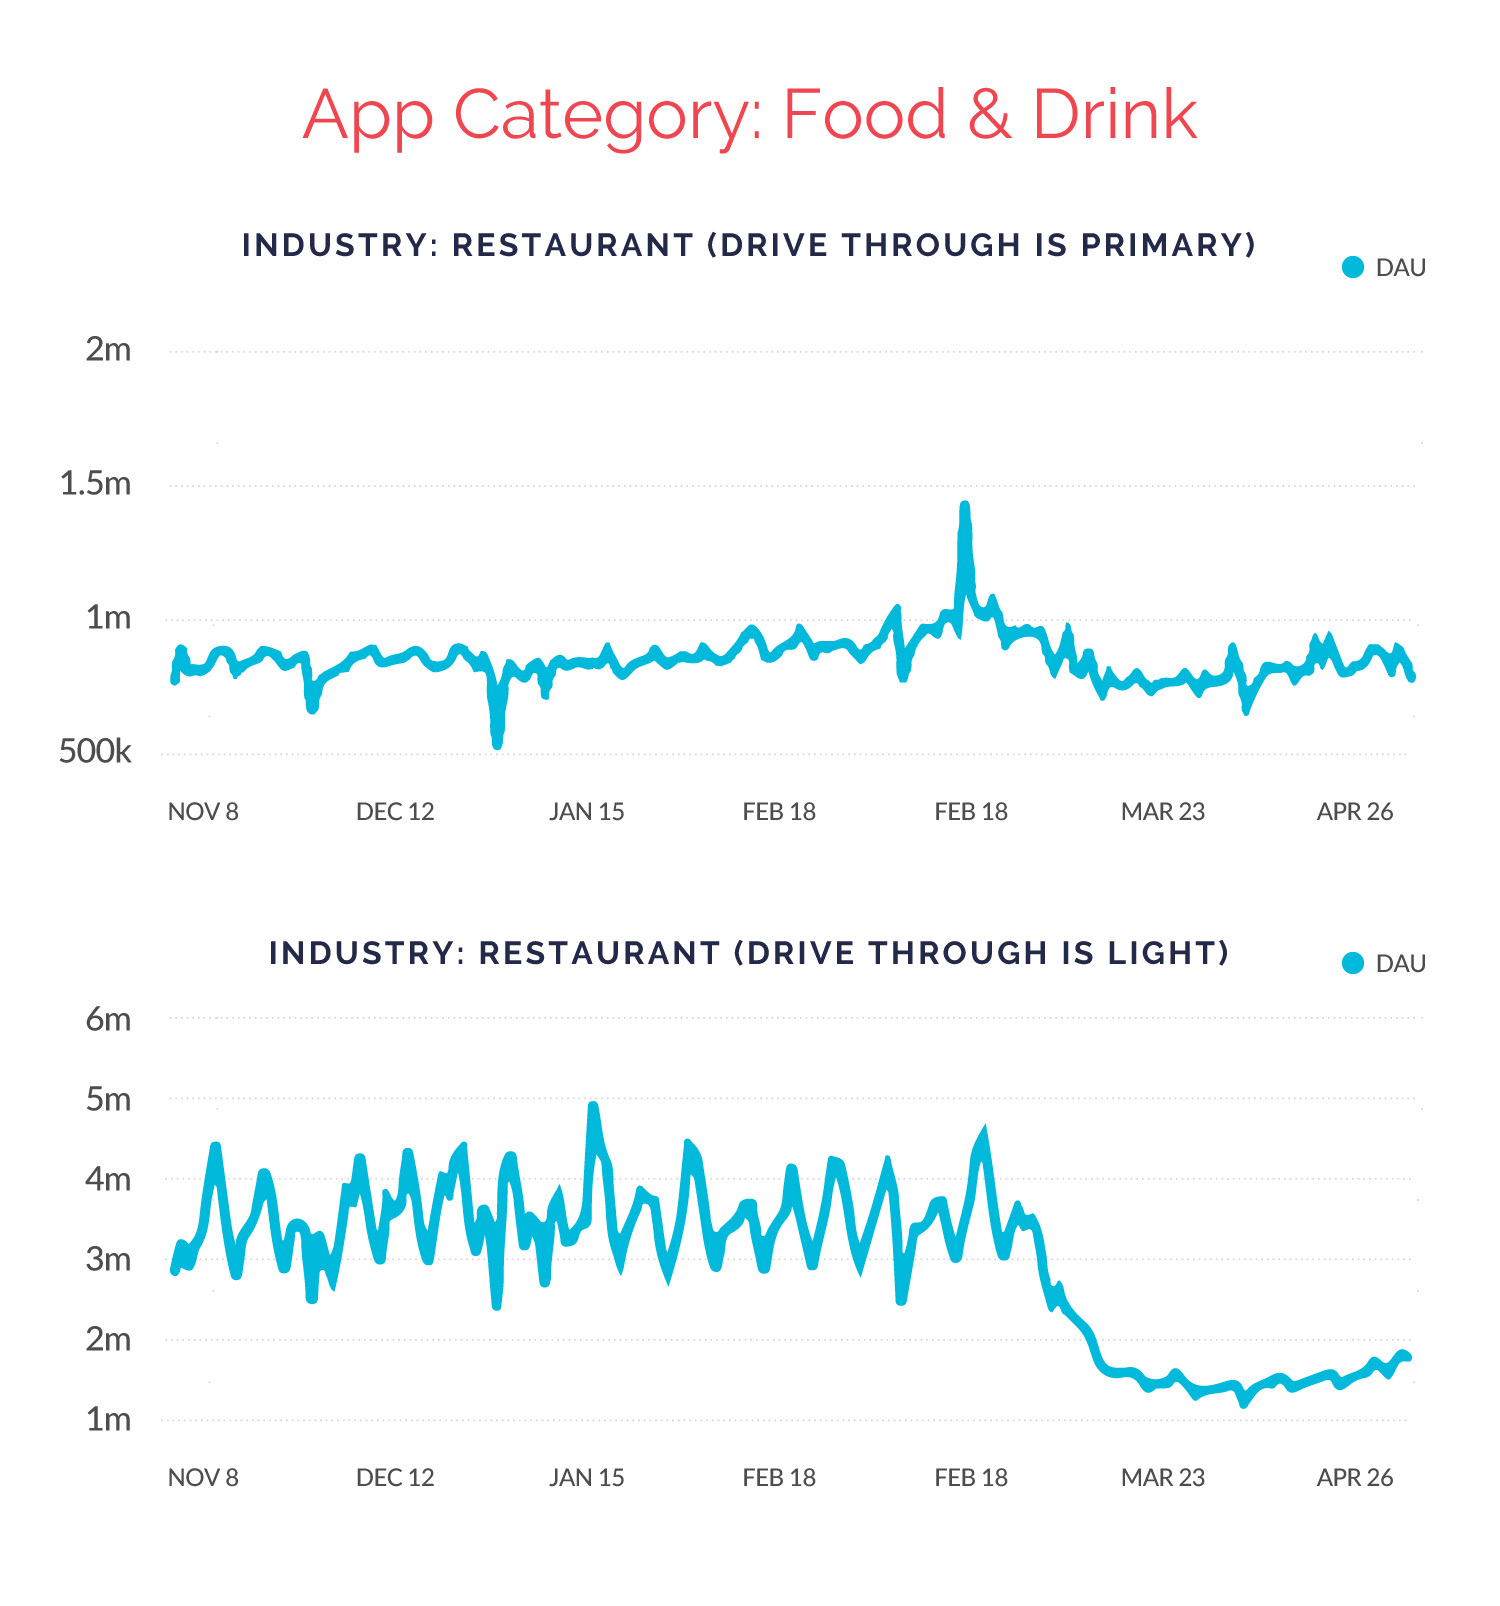
Apps in the Food and Drink category have seen an incredibly industry-specific impact.
The first two apps below are in the restaurant industry. Both apps are considered quick-service restaurants (QSRs), with one main differentiator: the first business relies heavily on the use of their drive through option, and the second business offers drive-through service, but not as a primary offering. The first QSR app’s DAU has fared relatively well through COVID-19’s impact, likely thanks to its ability to comply with social distancing by encouraging customers to use its drive through option. The second QSR app’s DAU was hit hard and continues to be negatively impacted as consumers are encouraged to continue staying at home.
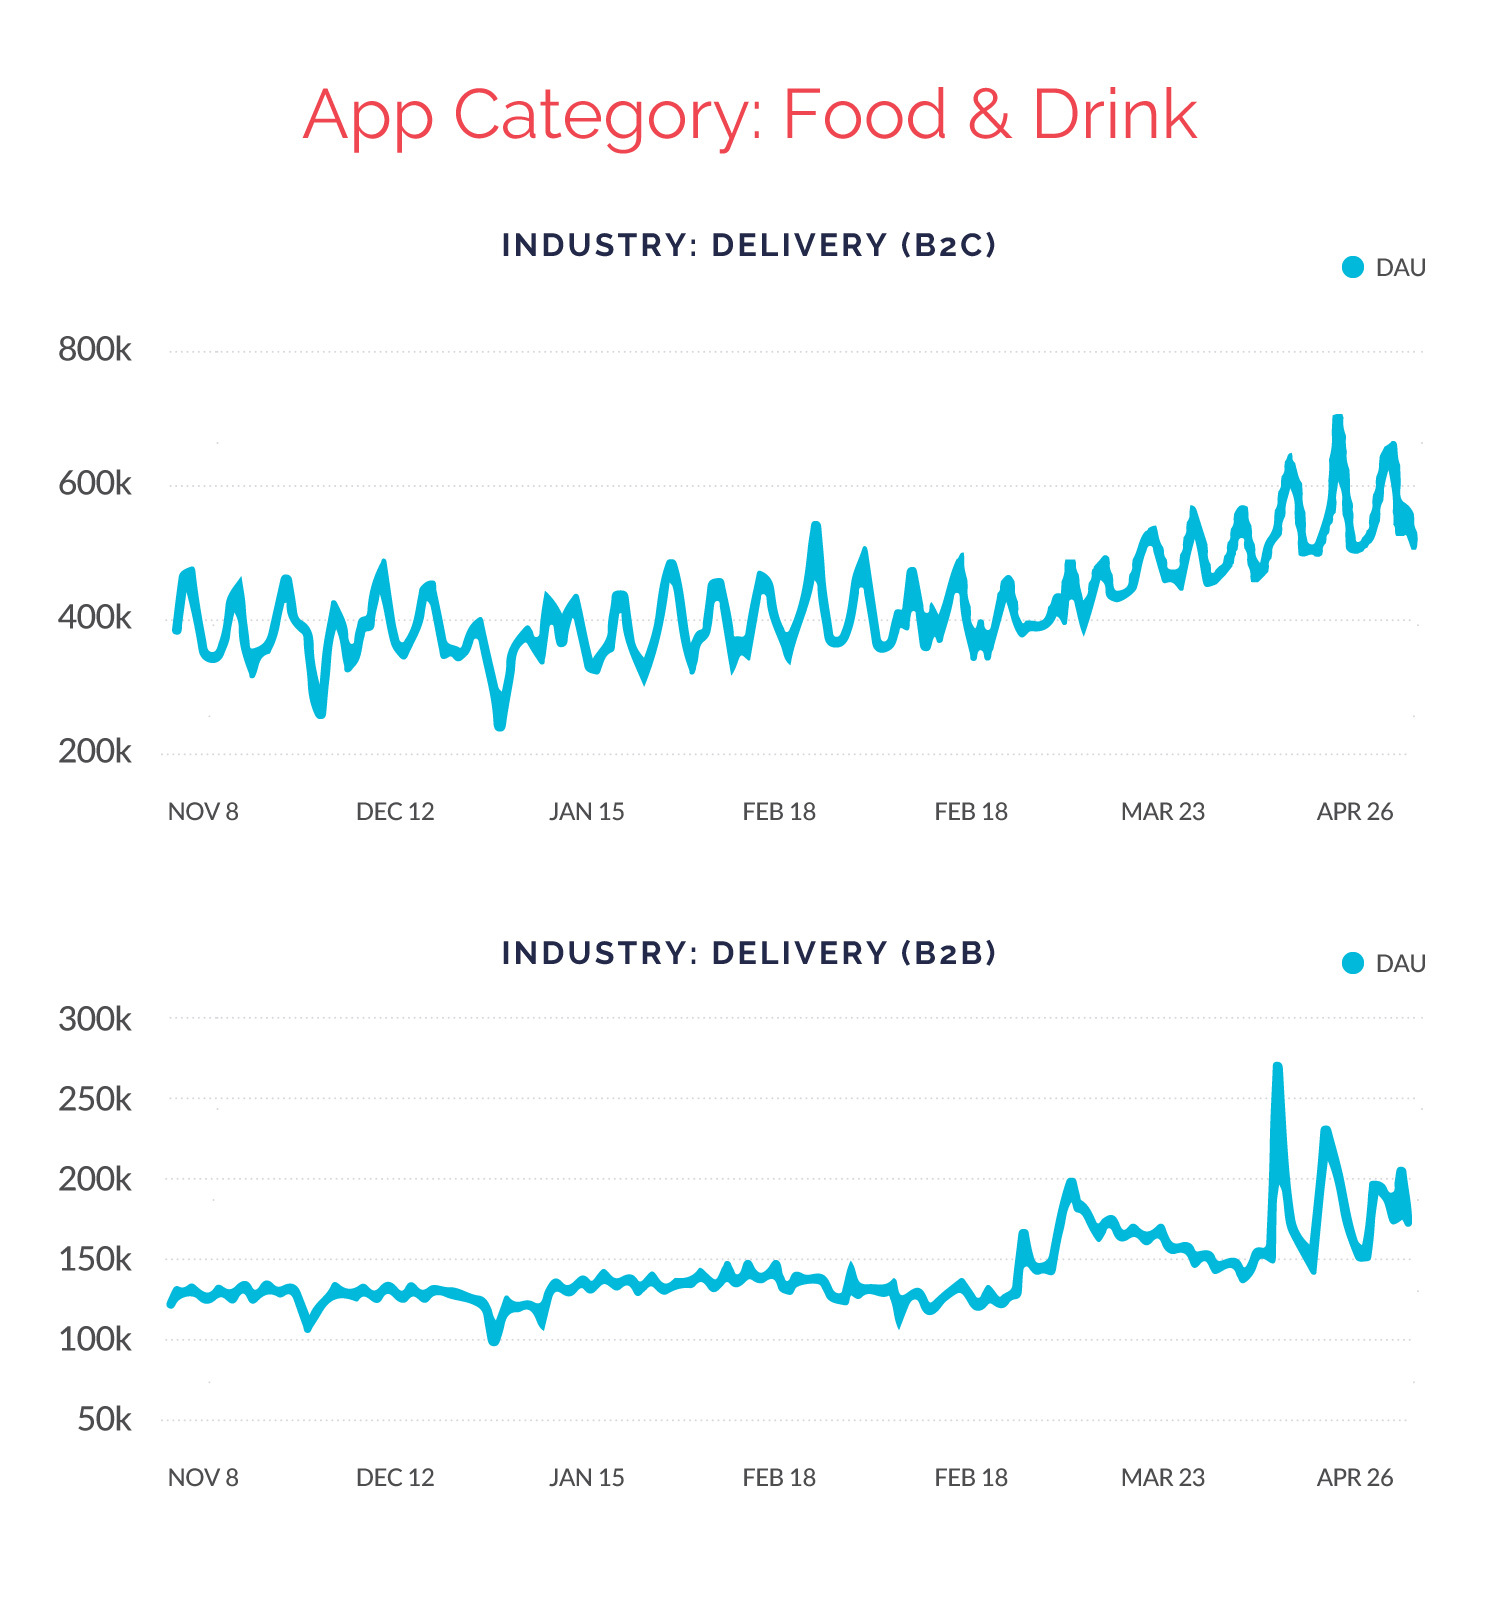
Let’s take a look at two apps from the same company, a restaurant delivery service. The first app is the company’s business-to-consumer app where customers order food to be delivered. The app saw a gradual but steady increase in DAU. The second app is the company’s business-to-business app their fleet of delivery drivers use. You can see the positive DAU impact over time, but the increase was much more volatile. The DAU impact tells two very different stories of groups of people following different patterns: staying at home or going out as an essential worker.
Category: Shopping
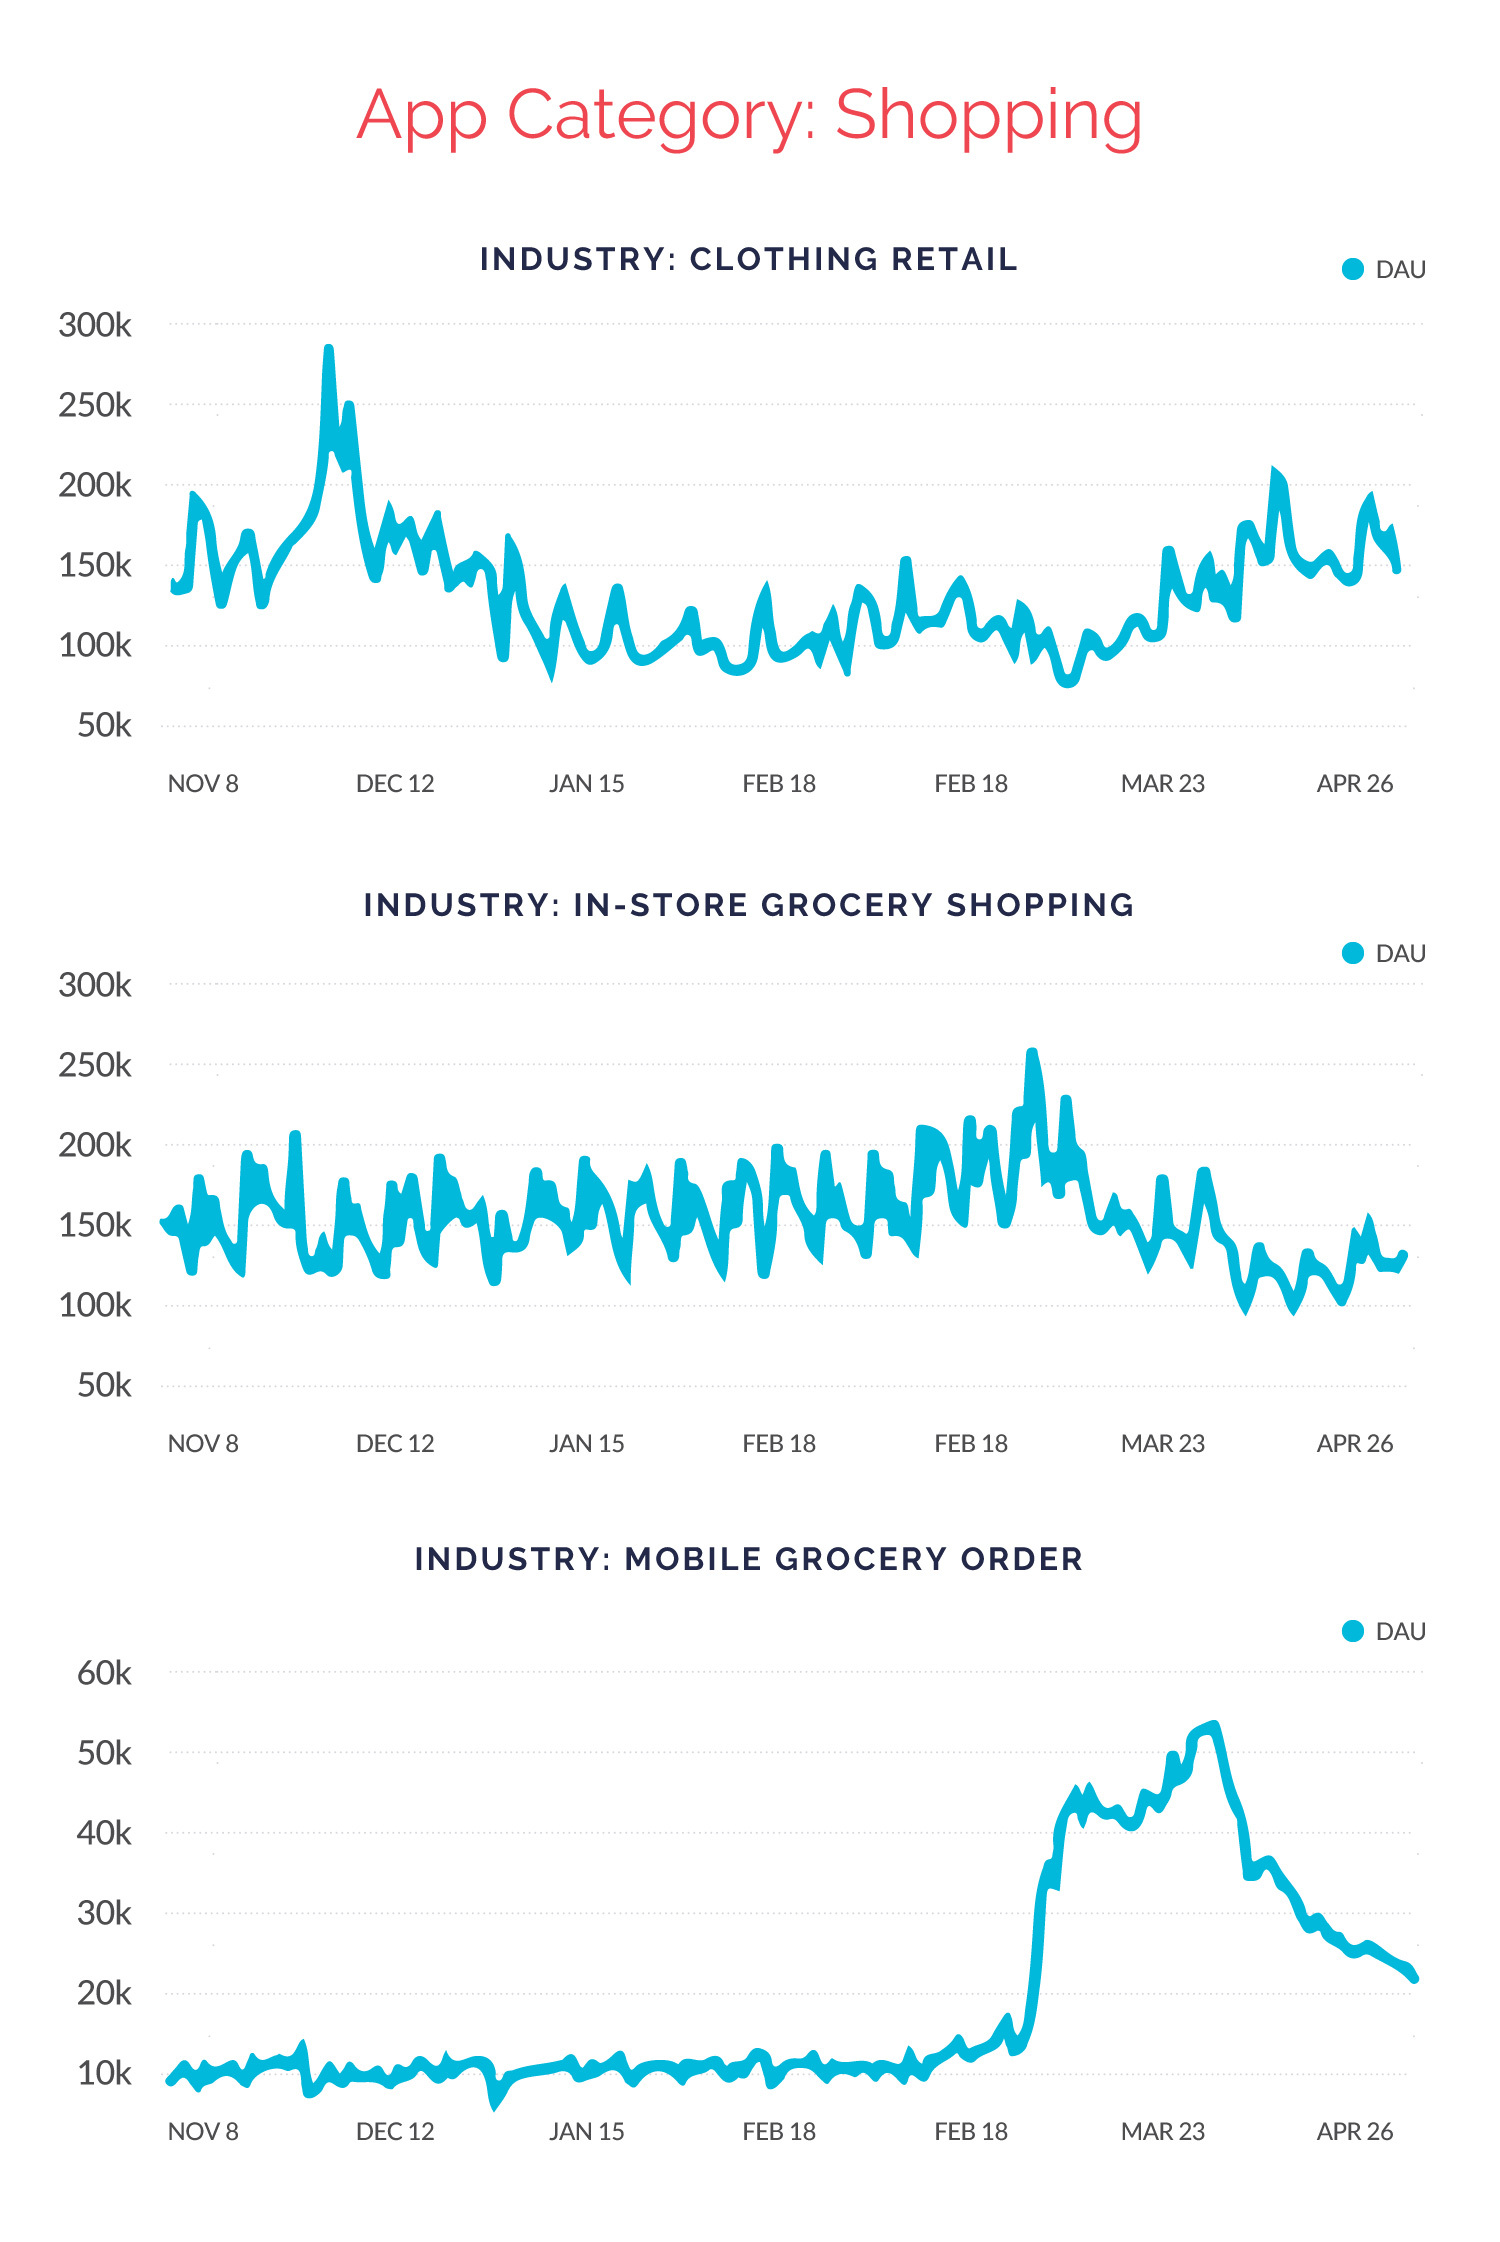
Apps in the Shopping category have seen major disparity based on industry. Let’s compare three apps in this category that serve very different purposes: clothing retail, in-store grocery shopping, and online grocery ordering.
The shared Shopping category is about the only similarity between the three apps. Unsurprisingly, DAU skyrocketed for the mobile grocery ordering app right as stay-at-home orders went into effect, and has begun leveling back down now that restrictions are being lifted (although engagement is still high, which is also unsurprising as many consumers who hadn’t experienced mobile grocery ordering are now having positive experiences). At the same time, the in-store grocery shopping app’s DAU dipped and has yet to recover. The clothing retail app saw a steady increase in DAU that has stayed higher than average — almost comparable to DAU during the holiday shopping season in Q4.
Category: Media
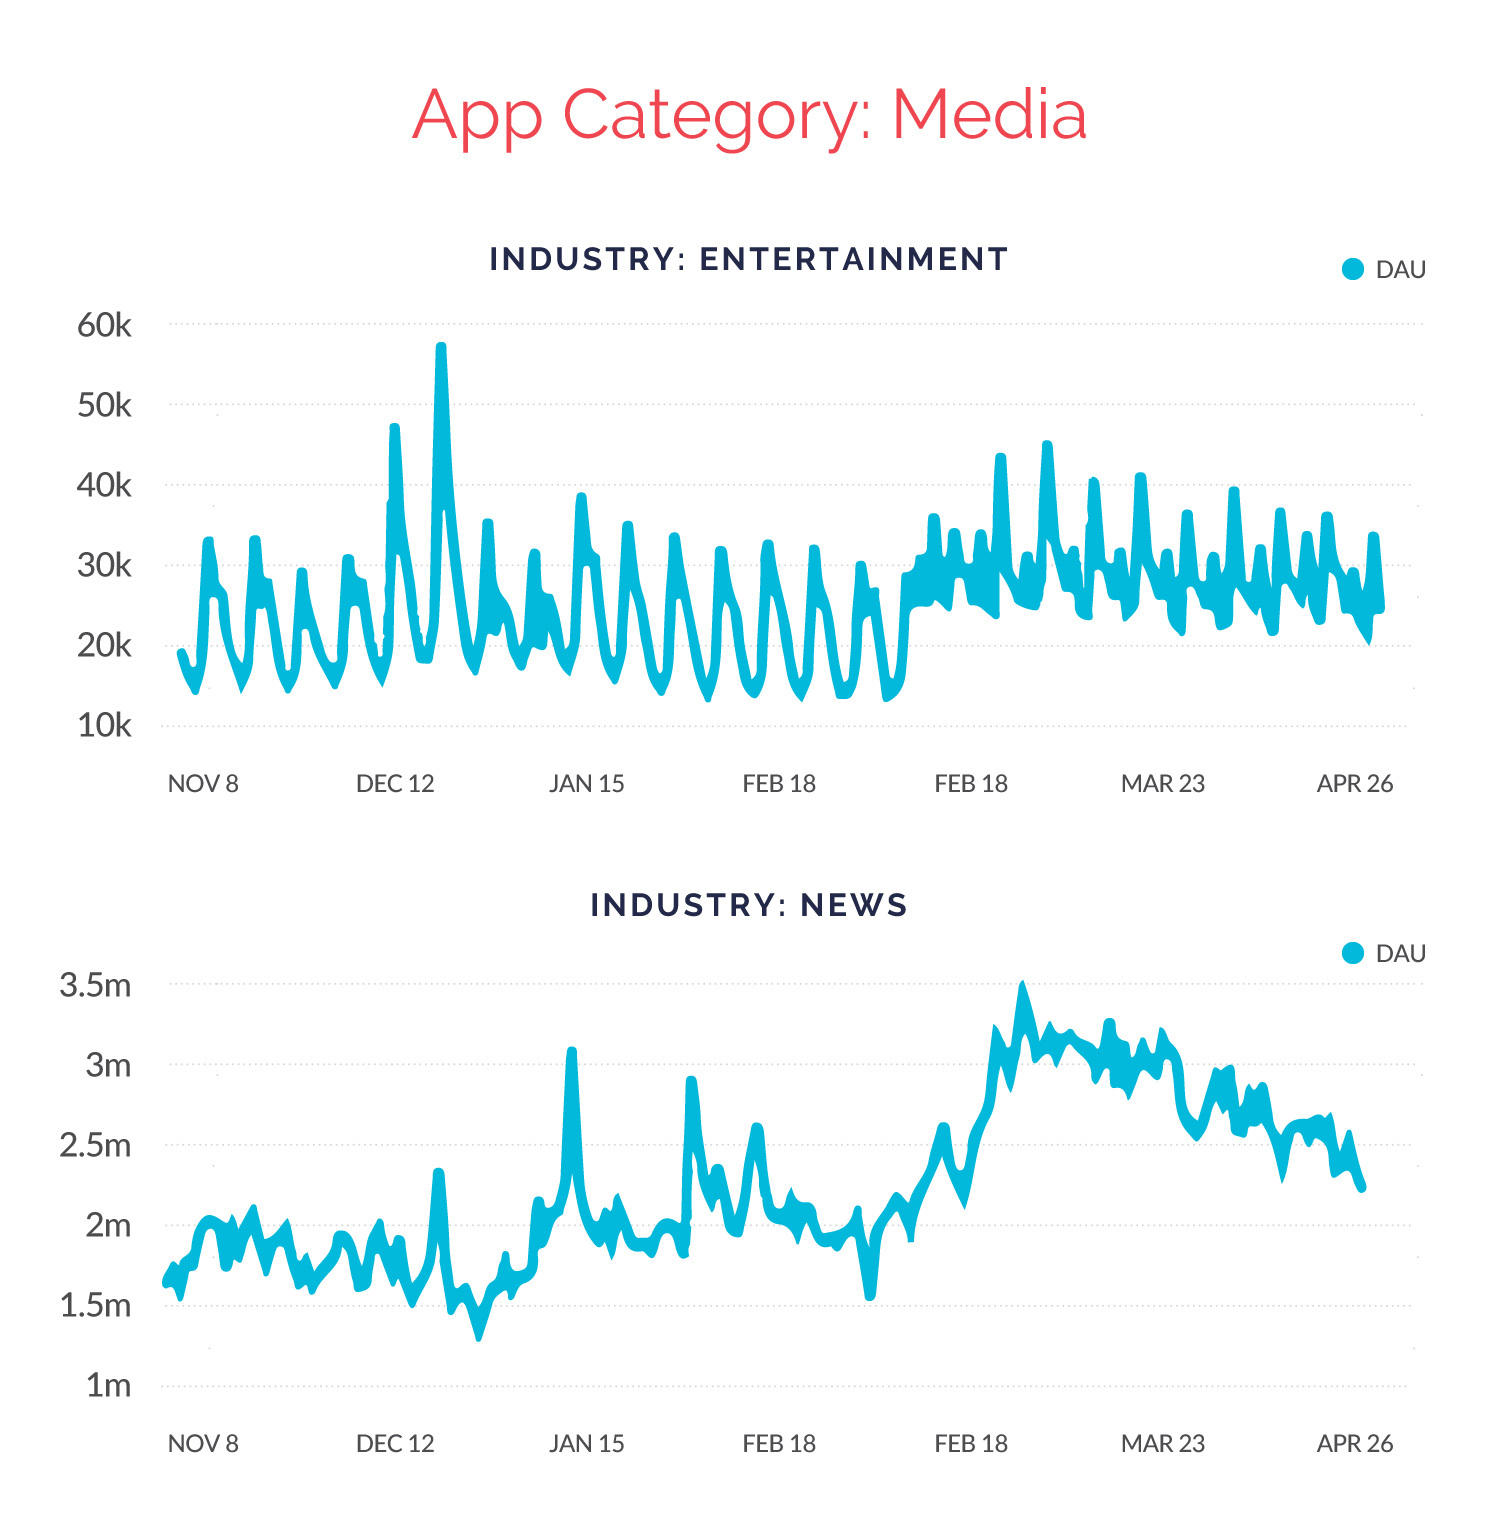
There are many different types of media, but as a category, brands have seen increases regardless of industry. The first type of app below is in the entertainment industry, and if there was ever a time to be in entertainment, it’s now. Consumers have found ways to fill the time at home, and many of us have chosen to binge new shows (I know you binged The Tiger King like we all did), listen to new podcasts, or catch up on movies we’ve wanted to watch.
Media apps in the news industry have also experienced a major DAU increase that’s held somewhat steady. As the country and the world continue sparring over what our future holds, media apps are the way we access much of the debate. It’s likely usage continues to stay high over the short-term future.
Category: Finance
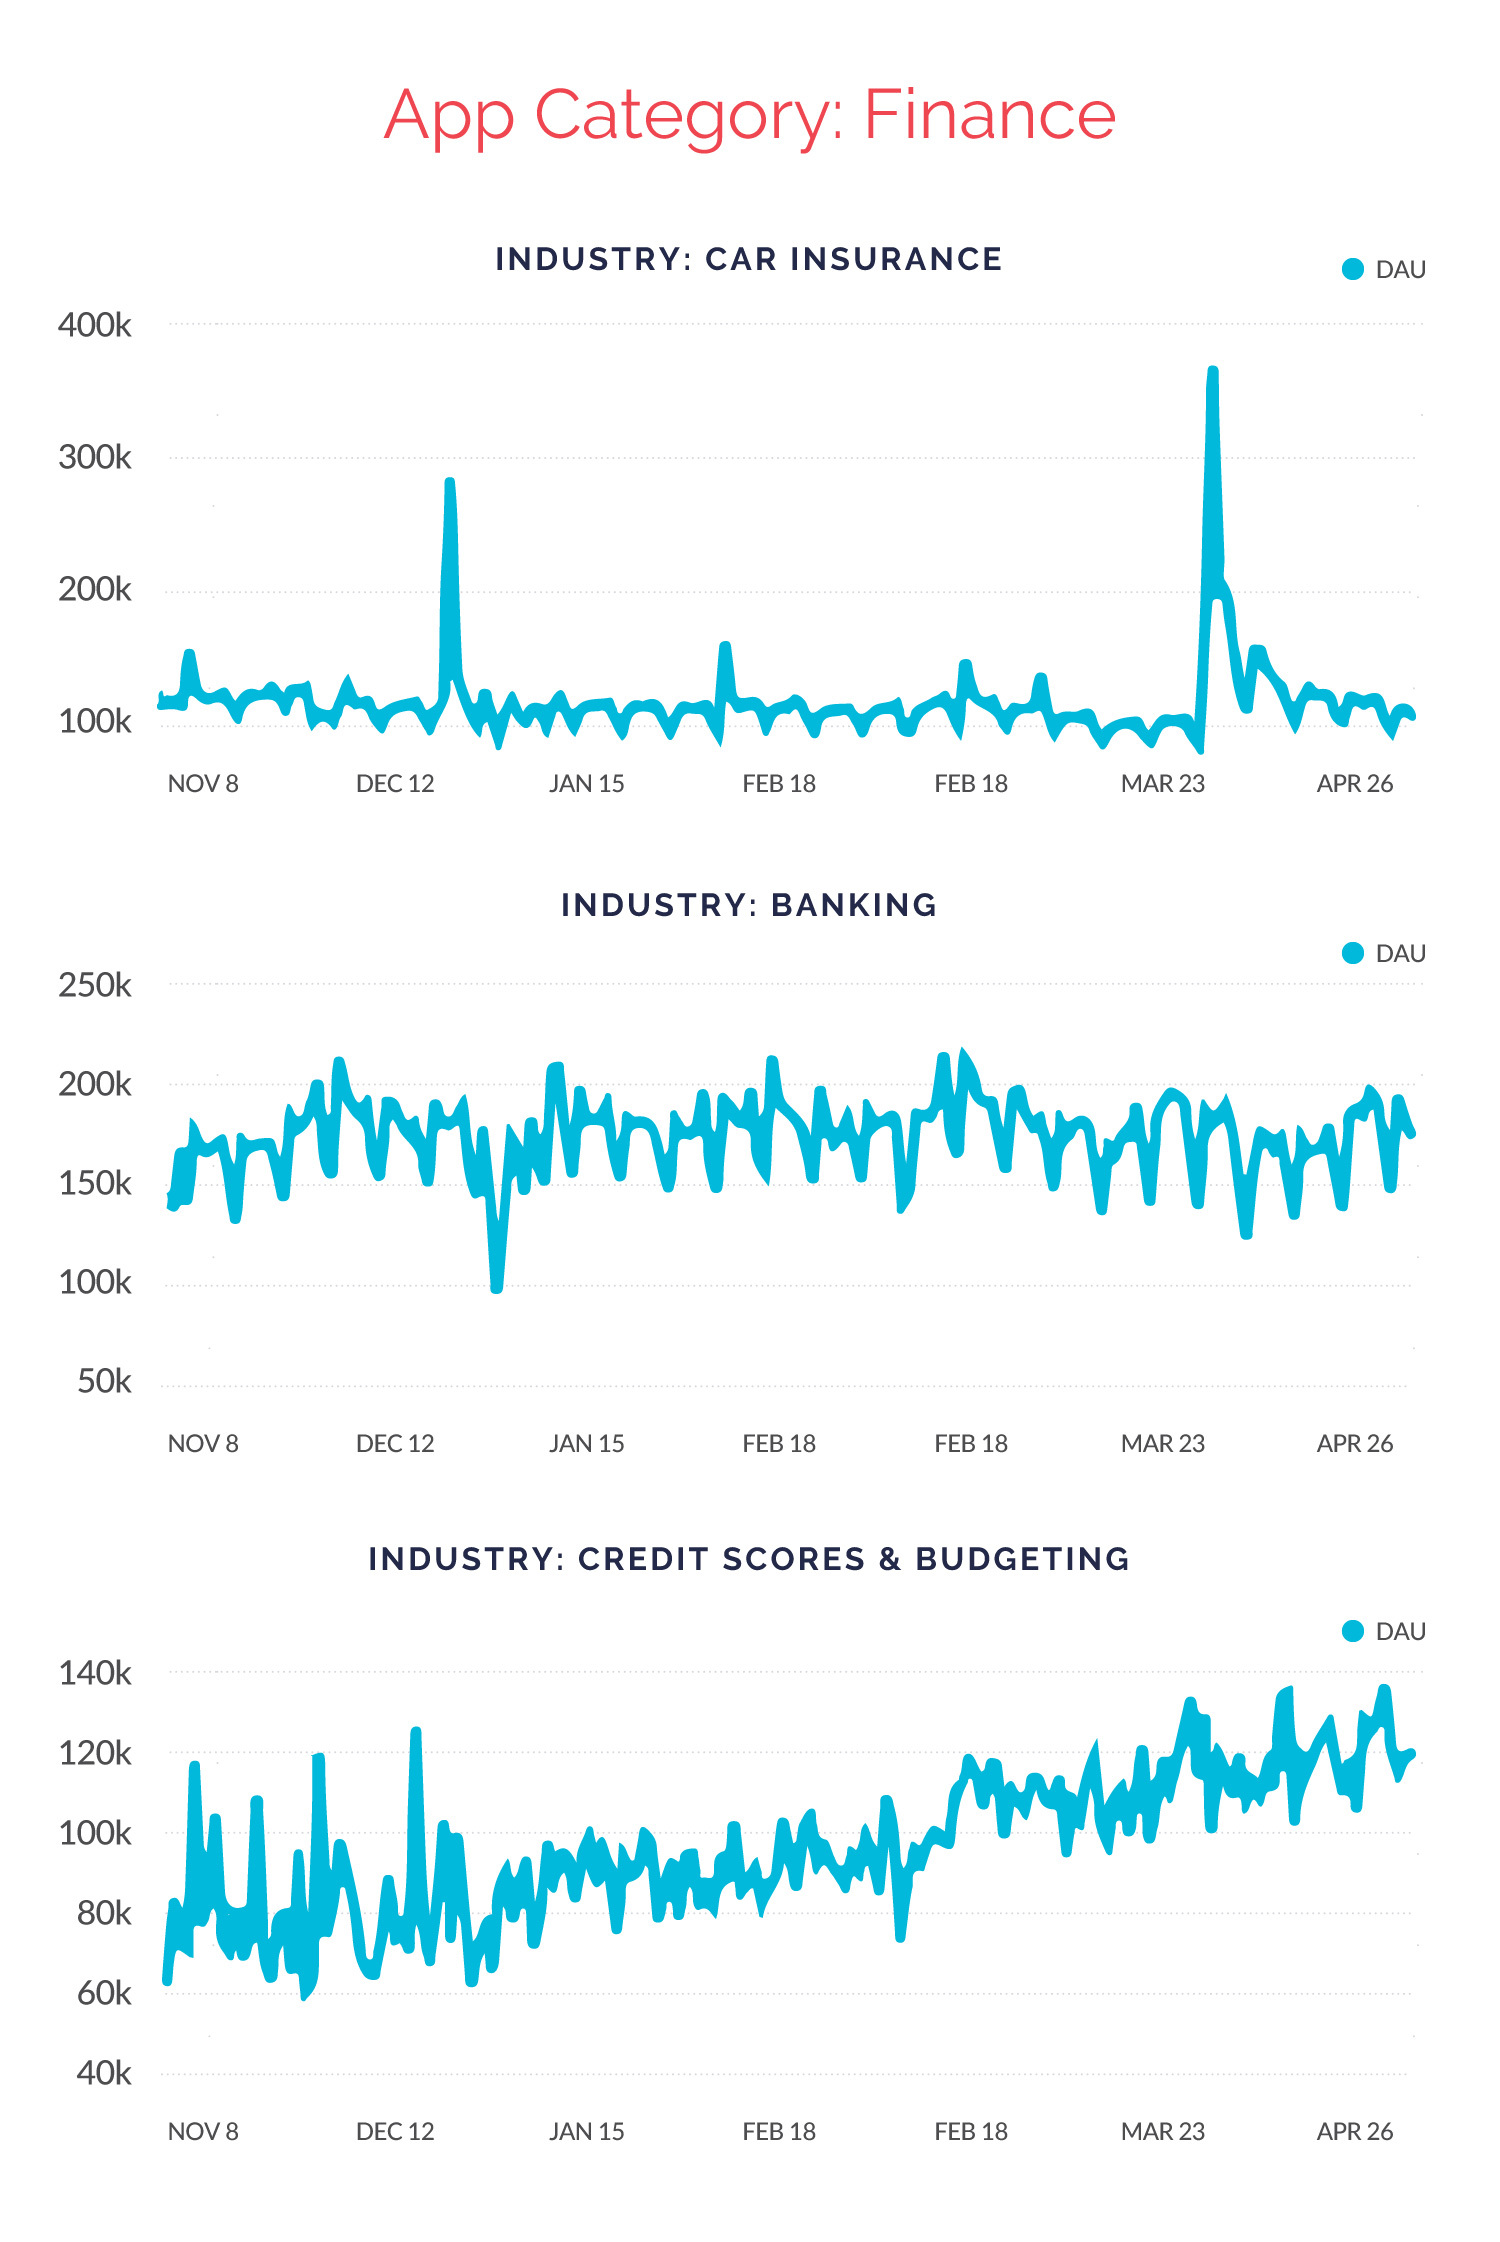
COVID-19 hit apps in the Finance category with a one-two punch, with heavy increases in usage as well as staggering drops in economic activity. Below, we compare three Finance apps in the car insurance, banking, and credit scores + budgeting industries.
The car insurance app saw a staggering increase in DAU immediately after stay-at-home orders began going into effect, likely due to many policy holders being eligible for partial refunds for their auto insurance or about removing coverage from cars that were placed in storage. Usage has since leveled out but remains slightly higher than normal as people begin going back to work and resuming daily life. Usage of the banking app stayed mostly consistent, which tells us most people aren’t checking their bank accounts more often than they usually do. Usage for the credit scores + budgeting app has consistently climbed, which offers some insight into how personal finances are faring during the economic shakeup. As unemployment rates continue to rise, people rely on budgets more heavily to make ends meet.
COVID-19 Mobile Customer Engagement Playbook
Already using Alchemer Mobile (formerly Apptentive) for mobile? If so, you’ve already completed the first step to using your mobile channel as a listening tool to better understand consumers, reduce churn, and increase retention. If not, we still want to help.
Below is our playbook to help you understand your customer feedback data, regardless of your industry. And remember, understanding and thoughtfully engaging your customers is the key to improve retention and reduce churn.
1. Are you seeing a change in DAU?
- Go to the App Health page of your Dashboard. Note that we do not expose DAU or MAU data for Alchemer Mobile (formerly Apptentive) for Web.
- In the upper right corner, set the date range to 180 days. This will populate the Dashboard with the last 6 months of your data. The goal is to see any changes that might be due to COVID-19, so setting this to several months before the pandemic hit will help make any trends more visible.
- Scroll to the bottom, where you’ll see the Active User section.
- Do you see a significant change in DAU patterns around the time that COVID-19 hit? Take note of this date, as we’ll use it as a baseline for understanding your data since COVID-19 impacted you most.
2. Add a Date Annotation for this date by going to Settings, then Date Annotations.
- Click “New Date Annotation”
- Set the start date to the date you noticed a change in DAU.
- In this case, we’ll also set the end date to that same date, since we do not yet know when the pandemic will subside.
- Add a clear title and a helpful description.
- Click “Save Annotation” when done. Now, you’ll be able to see this annotation whenever you look at App Health charts moving forward. This is a great way to put a special note on your charts for any significant events.

3. Take a closer look at your App Health data, using that Annotation as a guide. For best results, continue looking at six months of data.
- If you’re using the Love Dialog, do you see any changes to your Love Percent? What about the total number of Love Dialogs displayed? Remember, DAU is the top of the funnel. If DAU goes up, the total number of opportunities to engage customers with the Love Dialog will also likely go up and vice versa.
- Do you see any other trends with the count of Surveys or Notes displayed relative to the day your DAU changed?
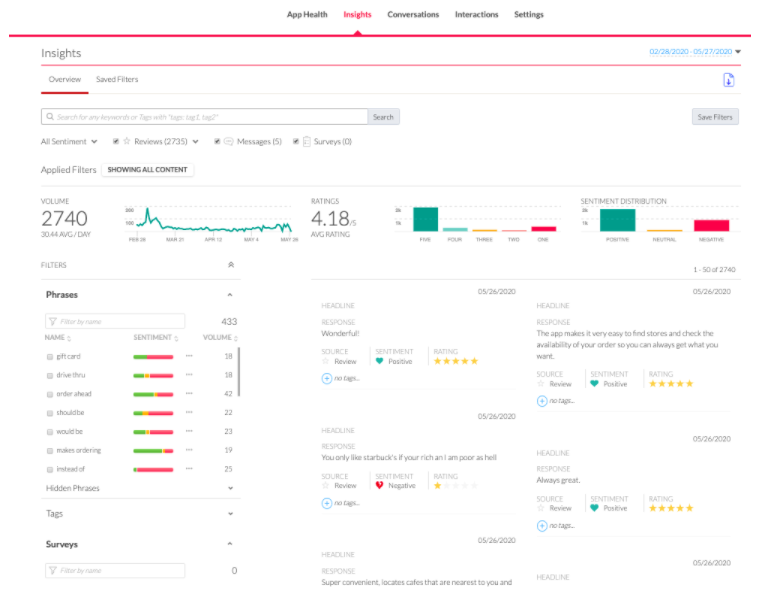
4. Use Insights to explore qualitative data
- Use the date selector in the upper right corner, setting the start date as the day in which your DAU started to change, and the end date as today.
- What are customers saying since COVID-19 hit?
- Every data set will be different, so explore Phrases, use Tags to keep track of important details, and use filters to sort through different types of data.
- Be sure to save the search for anything you find valuable. You can always come back and edit the data set later.
- If you’d like, change the date selector to show data from before the pandemic. How does the feedback compare to that post COVID-19? Again, save this search so that you can easily switch between pre and post COVID-19 data.
5. Use Insights searches for COVID-19 related keywords
- Want to look even more narrowly at COVID-19 specific data? Try adding COVID-19 related terms to the Insights search. Try things like “COVID-19” (and variations of that), “pandemic”, and “quarantine.” What are your customers saying when they mention these things?
Next Steps
Now that you’ve seen the data and real customer feedback, how do the takeaways impact your engagement strategy?
Whether you are an Alchemer Mobile (formerly Apptentive) customer or not, here are helpful questions and next steps to consider:
- Did your app see a spike in DAU or an increase in the frequency of DAU? If so, what type of feedback are they giving you? For example, is it product feedback, or possibly something that a support team could help them with?
- Did you see a drop in DAU? This means that you need to be especially thoughtful about engaging with customers, since you very well may have fewer opportunities. Ask yourself: If I have one chance to engage with a customer in the next three months, what should I communicate?
- Should it be to gather feedback, or do I need to let the know important information about our services?
- Run a COVID-19 survey. We’ve created a template to help you, and we’ll be anonymously publishing the results. To find the template, from your Dashboard navigate to Interactions, then Surveys, then select the COVID-19 Customer Survey from the dropdown.
- Consider running a Note. Does your company have important information that needs to be shared with customers? You can launch a Note that has that information, or even links to a URL for more details. A word of caution: be sure that you’re sharing valuable information, and not just creating more ‘noise’ for your customers.
- Read our full list of COVID-19 response recommendations to help craft sensitive, helpful messages for your consumers.
- Visit the COVID-19-dedicated section of our website for regular updates, specific feature recommendations, and more.
Listening to more of your customers can be a challenge, especially in the middle of a macroeconomic shakeup. But you don’t have to go it alone. If you’d like advice or additional information on the points we’ve covered, reach out to us for a chat.

